Sub Category
Latest Blogs
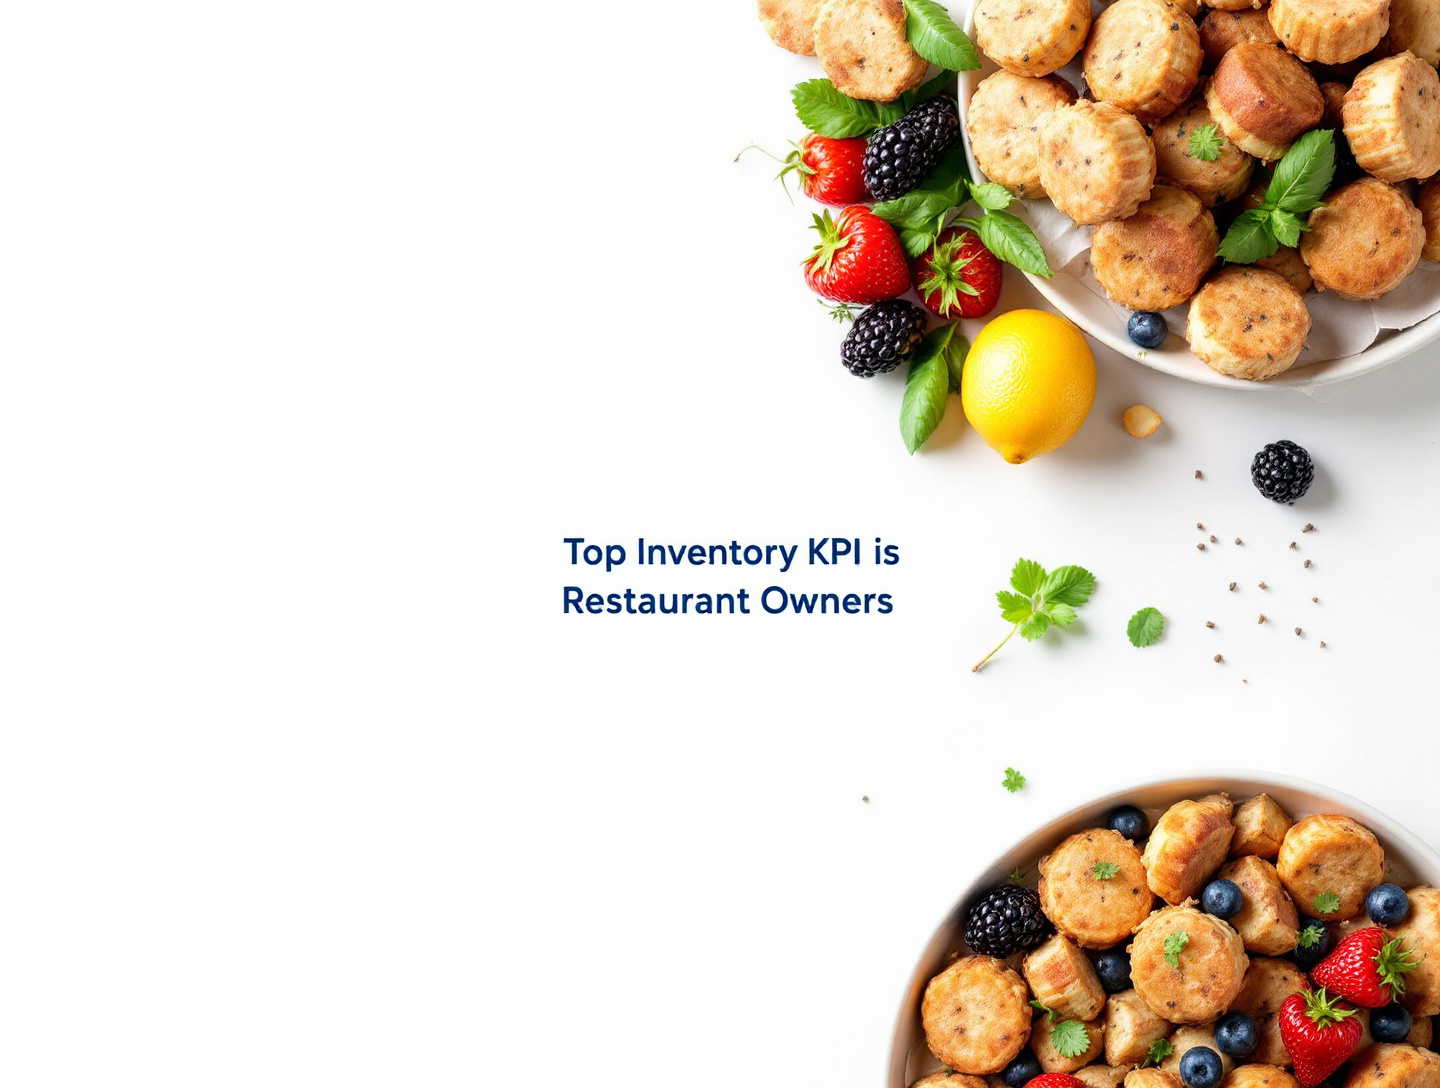
Top Inventory KPIs for Restaurant Owners: Metrics That Protect Profits
Introduction
Inventory is one of the largest controllable costs in any restaurant, yet it’s also one of the most misunderstood. Many restaurant owners focus heavily on sales, marketing, and customer experience but overlook the silent profit killer happening behind the scenes: poor inventory control. According to industry benchmarks, food and beverage inventory can account for 25–40% of a restaurant’s total operating costs, and even a 1–2% improvement in inventory efficiency can translate into tens of thousands of dollars in annual savings.
This is where inventory KPIs (Key Performance Indicators) come in. Inventory KPIs turn raw data—purchase invoices, stock counts, waste logs, and POS reports—into actionable insights. They help restaurant owners answer critical questions such as:
- Why is my food cost higher than last month?
- Which menu items are hurting my margins?
- How much inventory should I really be holding?
- Where am I losing money through waste, theft, or over-ordering?
In this in-depth guide, we’ll break down the top inventory KPIs for restaurant owners, explain how to calculate each one, and show how to use them to make smarter decisions. You’ll learn not just what to track, but why it matters, how often to review it, and what actions to take when numbers move in the wrong direction.
Whether you run a single-location café, a fast-casual brand, or a multi-unit restaurant group, this article will give you a practical KPI framework to protect margins, reduce waste, and build a more profitable operation.
Why Inventory KPIs Matter More Than Ever in Restaurants
The restaurant industry operates on notoriously thin margins—often 3–8% net profit in a good year. In such an environment, inventory mismanagement isn’t a minor issue; it’s an existential threat. Rising food costs, supply chain volatility, and labor shortages have made inventory control more complex than ever.
Inventory KPIs matter because they:
- Create visibility into where money is tied up in stock
- Highlight inefficiencies like over-portioning or spoilage
- Support forecasting during seasonal or demand shifts
- Enable accountability across managers and locations
Without KPIs, inventory decisions are based on gut feeling. With KPIs, they’re based on data.
Many restaurant owners already track food cost percentage, but that’s only one piece of the puzzle. A comprehensive KPI system looks at purchasing, usage, waste, turnover, and variance together. When aligned with POS and accounting data, inventory KPIs become a powerful management tool.
For a deeper look at aligning inventory data with business performance, see GitNexa’s guide on data-driven decision making for restaurants.
Food Cost Percentage (The Foundation KPI)
What It Is
Food Cost Percentage measures how much of your food sales revenue is spent on food inventory.
Formula:
Food Cost % = (Cost of Food Used ÷ Food Sales) × 100
Why It Matters
This is the most widely used inventory KPI in restaurants—and for good reason. It directly reflects profitability. Even a small increase in food cost percentage can erase profits.
Typical benchmarks:
| Restaurant Type | Ideal Food Cost % |
|---|---|
| Quick Service | 28–32% |
| Fast Casual | 25–30% |
| Casual Dining | 30–35% |
| Fine Dining | 32–38% |
How to Use It Effectively
- Track weekly, not just monthly
- Compare actual vs theoretical food cost
- Break it down by category (proteins, produce, dry goods)
Real-World Example
A casual dining restaurant noticed food cost creeping from 31% to 34% over three months. By analyzing subcategories, they discovered beef prices had increased 18%, but menu prices hadn’t changed. Adjusting portion sizes and updating menu pricing brought food cost back to 31%.
Inventory Turnover Ratio
What It Is
Inventory Turnover shows how often your inventory is sold and replaced during a specific period.
Formula:
Inventory Turnover = Cost of Goods Sold ÷ Average Inventory Value
Why It Matters
Low turnover means cash is tied up in stock, increasing the risk of spoilage and waste. High turnover usually indicates efficient purchasing and strong sales—but if it’s too high, you may be under-ordering and risking stockouts.
Benchmarks
Most restaurants aim for 4–8 inventory turns per month, depending on concept and menu.
Actionable Insight
If turnover is low:
- Reduce order quantities
- Eliminate slow-moving items
- Simplify menu SKUs
For strategies on improving operational efficiency, read restaurant process optimization tips.
Cost of Goods Sold (COGS)
What It Is
COGS represents the direct cost of producing the food you sell.
Formula:
COGS = Opening Inventory + Purchases – Closing Inventory
Why It Matters
COGS connects purchasing behavior with actual usage. Tracking COGS weekly helps identify issues faster than waiting for monthly reports.
Advanced Insight
Compare COGS trends against:
- Sales volume
- Menu changes
- Supplier price increases
A sudden spike in COGS without a sales increase often signals waste, theft, or portion control issues.
Inventory Variance (Actual vs Theoretical)
What It Is
Inventory Variance measures the difference between what inventory should be (based on sales and recipes) and what you actually have on hand.
Why It Matters
Variance exposes:
- Over-portioning
- Unrecorded waste
- Employee theft
- Receiving errors
Best Practice
- Conduct weekly physical counts
- Use standardized recipes
- Investigate variances over 2–3%
For more on reducing operational losses, see how to minimize restaurant shrinkage.
Waste Percentage
What It Is
Waste Percentage tracks how much inventory is lost due to spoilage, overproduction, or mistakes.
Formula:
Waste % = (Cost of Wasted Inventory ÷ Total Inventory Cost) × 100
Why It Matters
The USDA estimates that 30–40% of food in the U.S. is wasted, and restaurants are a significant contributor. Reducing waste directly improves profitability and sustainability.
Practical Tips
- Log waste daily
- Categorize waste reasons
- Adjust prep levels based on demand
Stockout Rate
What It Is
Stockout Rate measures how often you run out of key ingredients.
Why It Matters
Stockouts lead to:
- Lost sales
- Poor customer experience
- Menu inconsistency
KPI Target
Ideally, stockout rate should be below 2–3% for critical items.
Days Inventory on Hand (DIO)
What It Is
DIO shows how many days your current inventory will last.
Formula:
DIO = (Average Inventory ÷ COGS) × Number of Days
Why It Matters
Too many days on hand = waste risk. Too few = stockouts.
Balancing DIO is critical for perishable-heavy menus.
Purchase Price Variance (PPV)
What It Is
PPV measures the difference between expected and actual supplier prices.
Why It Matters
It helps identify:
- Supplier inconsistencies
- Contract compliance issues
- Opportunities for renegotiation
According to the National Restaurant Association, supplier price volatility has increased significantly since 2020, making PPV more important than ever.
Menu Item Contribution Margin
What It Is
Contribution Margin shows how much each menu item contributes to covering fixed costs and profit.
Formula:
Contribution Margin = Selling Price – Food Cost
Why It Matters
Inventory KPIs are incomplete without menu analysis. High-selling items with low margins can hurt overall profitability.
For deeper insights, explore menu engineering for profitability.
Inventory Accuracy Rate
What It Is
Inventory Accuracy Rate measures how closely system counts match physical counts.
Why It Matters
Low accuracy undermines all other KPIs. Aim for 95%+ accuracy.
Best Practices for Tracking Inventory KPIs
- Track KPIs weekly, not monthly
- Use POS-integrated inventory tools
- Standardize recipes and portions
- Train managers on KPI interpretation
- Review KPIs in management meetings
For tech enablement strategies, see restaurant technology solutions.
Common Mistakes Restaurant Owners Make with Inventory KPIs
- Tracking too many KPIs without action
- Ignoring variance reports
- Relying on manual spreadsheets
- Not aligning KPIs with menu strategy
- Failing to train staff
Real-World Use Case: Multi-Unit Restaurant Group
A five-location fast-casual brand implemented weekly inventory KPIs across all units. Within six months:
- Food cost dropped from 29% to 26.5%
- Waste reduced by 18%
- Annual savings exceeded $120,000
The key? Consistent tracking and accountability.
Tools and Software for Inventory KPI Tracking
Modern inventory management platforms integrate with POS systems to automate KPI reporting. According to Google’s hospitality analytics research, data-integrated restaurants are 23% more likely to outperform competitors.
FAQs
What are the most important inventory KPIs for restaurants?
Food cost percentage, inventory turnover, waste percentage, and inventory variance are the most critical.
How often should inventory KPIs be reviewed?
Weekly reviews are ideal for most restaurants.
Can small restaurants benefit from inventory KPIs?
Absolutely. In fact, small restaurants often see faster gains.
What is a good inventory turnover rate?
Typically 4–8 turns per month, depending on concept.
How do inventory KPIs reduce food waste?
They highlight over-ordering, spoilage, and prep inefficiencies.
Do I need software to track inventory KPIs?
While not mandatory, software improves accuracy and saves time.
How do KPIs help with menu pricing?
They reveal true food costs and contribution margins.
What causes high inventory variance?
Poor portion control, theft, waste, or inaccurate counts.
How long before KPIs show results?
Most restaurants see improvements within 30–90 days.
Conclusion: Turning Inventory Data into Profit
Inventory KPIs are not just numbers—they’re decision-making tools. When tracked consistently and acted upon, they can dramatically improve profitability, reduce waste, and stabilize operations in an unpredictable industry.
The future of restaurant success belongs to operators who embrace data, transparency, and continuous improvement. Inventory KPIs are the foundation of that future.
Ready to Optimize Your Restaurant Inventory?
If you want expert guidance on implementing inventory KPIs, integrating technology, or optimizing restaurant operations, GitNexa can help.
👉 Get a free consultation today and start turning inventory insights into real profits.
Comments
Loading comments...