Sub Category
Latest Blogs
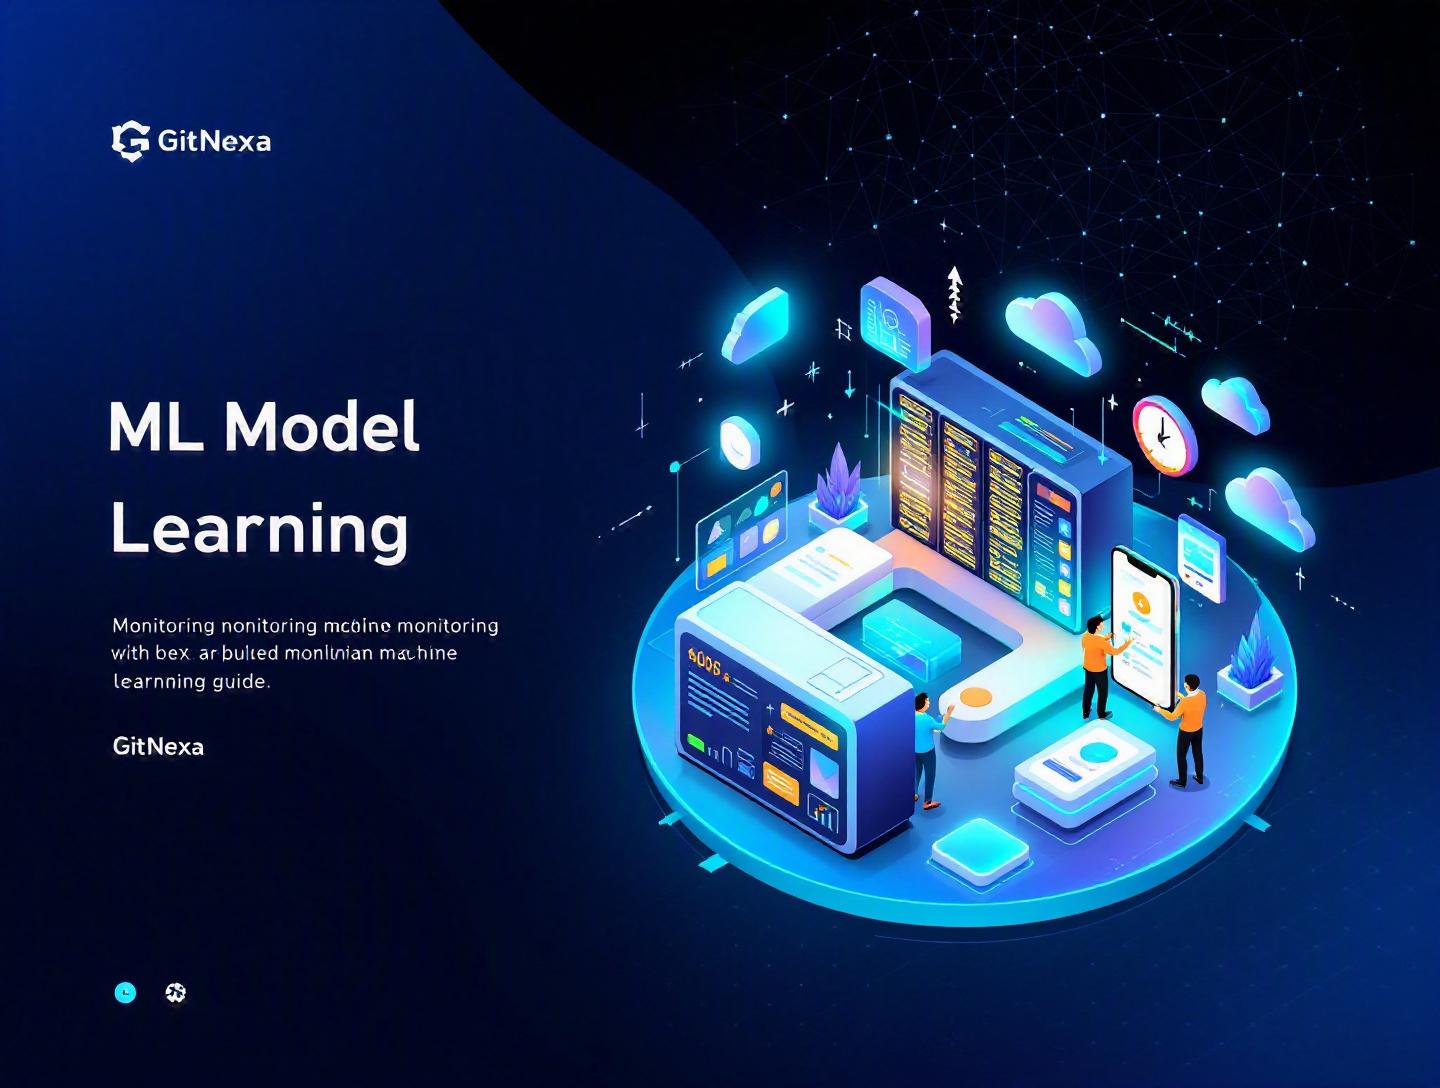
The Ultimate Guide to Monitoring Machine Learning Models
Introduction
In 2024, Gartner estimated that more than 60% of machine learning models in production fail to deliver their expected business value due to data drift, model decay, or operational issues. Not because the algorithms were flawed. Not because the teams lacked talent. But because nobody was actively monitoring machine learning models once they were deployed.
That’s the uncomfortable truth: building a high-performing model is only half the battle. The real challenge begins after deployment.
Monitoring machine learning models is the discipline of continuously tracking model performance, data quality, prediction behavior, and system health in production environments. Without it, even the most sophisticated neural network can quietly degrade, producing inaccurate predictions, biased decisions, or costly errors.
If you're a CTO overseeing AI initiatives, a startup founder betting on predictive analytics, or a data engineer responsible for ML infrastructure, this guide is for you. We’ll break down what monitoring machine learning models actually involves, why it matters more than ever in 2026, the core components of a production-grade monitoring stack, practical implementation steps, common mistakes, and what the future holds.
Let’s start with the basics.
What Is Monitoring Machine Learning Models?
Monitoring machine learning models refers to the continuous observation and evaluation of models after they are deployed into production. It ensures that models remain accurate, reliable, fair, and aligned with business goals over time.
Unlike traditional software systems, ML models are probabilistic. Their performance depends on real-world data that constantly changes. That means production monitoring isn’t optional—it’s fundamental.
At a high level, monitoring machine learning models involves tracking:
- Model performance metrics (accuracy, precision, recall, F1, AUC)
- Data quality and schema consistency
- Data drift and concept drift
- Prediction distributions
- Infrastructure metrics (latency, memory, throughput)
- Bias and fairness indicators
Traditional Monitoring vs ML Monitoring
In standard DevOps, monitoring focuses on uptime, response times, CPU usage, and error rates. With ML systems, you’re adding a new dimension: statistical performance.
Here’s a comparison:
| Aspect | Traditional App Monitoring | ML Model Monitoring |
|---|---|---|
| Focus | System health | Model + data + system |
| Metrics | Latency, errors | Accuracy, drift, bias |
| Failure Mode | Service crashes | Silent performance decay |
| Observability | Logs, traces | Predictions, distributions |
The biggest risk? Silent failure. A model can continue serving predictions while becoming increasingly wrong.
Types of Monitoring in ML Systems
Monitoring machine learning models typically includes five categories:
1. Data Quality Monitoring
Checks for missing values, schema mismatches, out-of-range values, or distribution shifts.
2. Data Drift Monitoring
Compares live production data to training data distributions.
3. Concept Drift Monitoring
Detects changes in the relationship between inputs and outputs.
4. Model Performance Monitoring
Tracks real-world accuracy once ground truth becomes available.
5. Infrastructure Monitoring
Ensures the model service is scalable and performant.
Together, these layers create an ML observability framework.
Why Monitoring Machine Learning Models Matters in 2026
By 2026, the global AI market is projected to exceed $500 billion (Statista, 2025). Yet enterprise AI adoption still struggles with operational maturity.
The reason? Deployment is easy. Sustained performance is hard.
1. Data Is Changing Faster Than Ever
User behavior shifts. Markets fluctuate. Regulations evolve. Generative AI systems produce synthetic data that influences downstream models. The half-life of clean training data is shrinking.
Consider a fintech fraud detection model trained in 2023. By 2026, new fraud patterns, digital wallets, and cross-border transactions dramatically alter transaction characteristics. Without monitoring, false negatives increase silently.
2. Regulatory Pressure Is Increasing
The EU AI Act (2024) mandates ongoing monitoring for high-risk AI systems. Similar compliance requirements are emerging in the US and Asia.
Monitoring machine learning models is now a legal requirement in certain industries.
3. Customer Trust Is Fragile
Amazon famously scrapped an AI recruiting tool in 2018 after bias issues surfaced. Today, such failures go viral in hours.
Monitoring helps detect fairness issues early—before reputational damage occurs.
4. AI Is Moving to Edge and Real-Time Systems
From autonomous vehicles to IoT healthcare devices, models are operating in dynamic environments. Edge deployments demand continuous feedback loops.
5. LLMs and Generative AI Add New Complexity
Large Language Models require monitoring for:
- Hallucinations
- Toxicity
- Prompt injection vulnerabilities
- Output drift
Traditional metrics aren’t enough anymore.
Now let’s break down the core components in detail.
Core Components of Monitoring Machine Learning Models
1. Data Quality Monitoring
Data quality issues are the most common root cause of model failure.
What to Track
- Missing values percentage
- Schema changes
- Value ranges
- Feature distributions
- Categorical cardinality
Example: E-commerce Recommendation Engine
If a "price" feature suddenly contains null values due to an upstream API change, your recommendation model may degrade instantly.
Implementation Example (Python with Evidently)
from evidently.report import Report
from evidently.metric_preset import DataDriftPreset

report = Report(metrics=[DataDriftPreset()])
report.run(reference_data=train_df, current_data=prod_df)
report.save_html("drift_report.html")
Tools commonly used:
- Evidently AI
- Great Expectations
- Monte Carlo
- WhyLabs
For teams building scalable data systems, combining monitoring with a strong data pipeline architecture is critical. We often recommend reviewing modern patterns like those discussed in our guide to cloud data engineering best practices.
2. Data Drift & Concept Drift Detection
Data drift measures changes in input distributions. Concept drift measures changes in the relationship between inputs and outputs.
Statistical Methods
- Kolmogorov-Smirnov test
- Population Stability Index (PSI)
- Jensen-Shannon divergence
- Chi-square test
Example: Credit Scoring Model
If average applicant income shifts significantly during an economic downturn, PSI scores may exceed 0.2—indicating moderate drift.
| PSI Value | Interpretation |
|---|---|
| < 0.1 | No drift |
| 0.1–0.2 | Moderate drift |
| > 0.2 | Significant drift |
Workflow for Drift Monitoring
- Store training data distributions
- Log production feature data
- Compute statistical distances daily
- Trigger alerts when thresholds exceed limits
- Initiate retraining pipeline
This is where MLOps practices become essential. If you're building CI/CD pipelines for ML, our article on implementing DevOps for AI systems explores automation strategies in detail.
3. Model Performance Monitoring
Tracking offline validation accuracy is not enough. You need real-world feedback.
Online vs Offline Metrics
- Online: click-through rate, conversion rate
- Offline: precision, recall, ROC-AUC
Example: Ad Targeting Platform
Suppose your click prediction model shows 0.89 AUC in validation. In production, CTR drops by 12% over three months. That’s model decay.
Delayed Ground Truth Problem
In fraud detection, labels may take weeks to confirm. Use proxy metrics:
- Prediction confidence
- Anomaly scores
- Business KPIs
Monitoring Dashboard Example
Model: FraudClassifier_v3
Accuracy (30-day rolling): 91.2%
PSI (Income Feature): 0.23
Latency P95: 180ms
Alert: Drift Threshold Exceeded
Integrating these metrics into observability tools like Prometheus + Grafana or Datadog keeps engineering and business teams aligned.
4. Infrastructure & System Monitoring
Machine learning systems are still software systems.
Track:
- API latency
- Throughput (requests/sec)
- GPU/CPU utilization
- Memory usage
- Container health
Example Kubernetes Monitoring
apiVersion: autoscaling/v2
kind: HorizontalPodAutoscaler
spec:
  minReplicas: 2
  maxReplicas: 10
  metrics:
  - type: Resource
    resource:
      name: cpu
      target:
        type: Utilization
        averageUtilization: 70
When scaling ML APIs, our Kubernetes deployment strategies article outlines production-ready patterns.
5. Bias & Fairness Monitoring
AI bias is not static. It evolves with data.
Track fairness metrics:
- Demographic parity
- Equal opportunity
- Disparate impact ratio
Example: Lending Platform
If approval rates for a demographic group drop from 65% to 48% without clear economic cause, you need investigation.
Libraries:
- IBM AI Fairness 360
- Fairlearn
Monitoring bias isn’t just ethical—it’s increasingly regulatory.
Architecture Patterns for Monitoring Machine Learning Models
A typical production architecture looks like this:
User → API Gateway → Model Service → Prediction Log Store
                              ↓
                        Monitoring Engine
                              ↓
                         Alerting System
                              ↓
                         Retraining Pipeline
Step-by-Step Implementation Blueprint
- Log every prediction with features and timestamp
- Store logs in a data warehouse (BigQuery, Snowflake)
- Schedule daily drift jobs
- Push metrics to monitoring system
- Trigger Slack/PagerDuty alerts
- Automate retraining via CI/CD pipeline
- Version models using MLflow
For teams modernizing their AI infrastructure, combining this with scalable backend systems—like those described in our enterprise web application architecture guide—creates long-term stability.
How GitNexa Approaches Monitoring Machine Learning Models
At GitNexa, we treat monitoring machine learning models as a first-class engineering discipline—not an afterthought.
Our approach combines:
- Production-grade MLOps pipelines
- Automated drift detection workflows
- Real-time observability dashboards
- Cloud-native infrastructure (AWS, Azure, GCP)
- Compliance-aware logging frameworks
We design monitoring layers alongside model development. That means defining drift thresholds, logging strategies, and retraining triggers before deployment—not months later.
Our AI engineering team integrates tools like MLflow, Kubeflow, Prometheus, and Evidently AI into scalable architectures. We also align monitoring metrics with business KPIs so stakeholders understand what "model health" means in revenue terms.
If you're building intelligent systems from scratch, explore our perspective on custom AI development services to understand how we structure production-ready ML systems.
Common Mistakes to Avoid
-
Only Monitoring Accuracy
Accuracy alone hides distribution shifts and bias. -
Ignoring Data Quality Checks
Schema mismatches silently break models. -
No Logging Strategy
Without prediction logs, root cause analysis becomes impossible. -
Manual Drift Detection
Spreadsheets don’t scale. Automate it. -
Delayed Alerts
Weekly reviews are too slow for high-volume systems. -
No Retraining Plan
Monitoring without retraining pipelines creates bottlenecks. -
Overlooking Business Metrics
Technical metrics must map to revenue or risk impact.
Best Practices & Pro Tips
-
Define Monitoring Before Deployment
Add monitoring requirements to model design docs. -
Set Quantitative Drift Thresholds
Avoid vague alerts—define PSI or KS limits. -
Monitor Feature Importance Over Time
Sudden shifts indicate instability. -
Use Shadow Deployments
Test new models against live traffic safely. -
Version Everything
Data, models, code, and configurations. -
Combine Statistical + Business Metrics
Tie predictions to ROI. -
Automate Retraining
Use scheduled pipelines or trigger-based retraining. -
Document Incidents
Create postmortems for model failures.
Future Trends & What to Expect (2026–2027)
Monitoring machine learning models is evolving rapidly.
1. AI Observability Platforms
Unified platforms combining logs, traces, drift, and LLM evaluation.
2. LLM-Specific Monitoring
Tools measuring hallucination rates and prompt safety.
3. Real-Time Adaptive Models
Self-correcting models updating continuously.
4. Edge AI Monitoring
Lightweight monitoring agents for IoT devices.
5. Regulatory Monitoring APIs
Built-in compliance reporting frameworks.
Expect monitoring to become as standardized as CI/CD pipelines.
FAQ: Monitoring Machine Learning Models
1. What is monitoring in machine learning?
It is the continuous tracking of model performance, data quality, drift, and system health after deployment.
2. Why do ML models degrade over time?
Because real-world data changes, causing data drift or concept drift.
3. How often should models be monitored?
Critical systems require real-time monitoring; others may use daily or weekly checks.
4. What tools are used for ML monitoring?
Evidently AI, WhyLabs, MLflow, Prometheus, Grafana, and Great Expectations.
5. What is data drift in machine learning?
It refers to changes in the distribution of input features compared to training data.
6. What is concept drift?
It occurs when the relationship between inputs and outputs changes over time.
7. Is ML monitoring required by law?
In some industries and regions (like the EU AI Act), yes.
8. How do you detect model bias in production?
By tracking fairness metrics such as demographic parity and disparate impact.
9. What is PSI in ML monitoring?
Population Stability Index measures distribution changes between datasets.
10. Can monitoring be automated?
Yes. Most production systems integrate automated alerts and retraining triggers.
Conclusion
Monitoring machine learning models is not optional—it’s the backbone of reliable AI systems. Models decay. Data shifts. Regulations tighten. Customer expectations rise.
The teams that succeed in AI aren’t the ones with the flashiest algorithms. They’re the ones with disciplined monitoring, automated retraining, and clear visibility into model health.
If you're deploying or scaling ML systems, now is the time to invest in production-grade monitoring frameworks.
Ready to build resilient, production-ready AI systems? Talk to our team to discuss your project.
Comments
Loading comments...