Sub Category
Latest Blogs
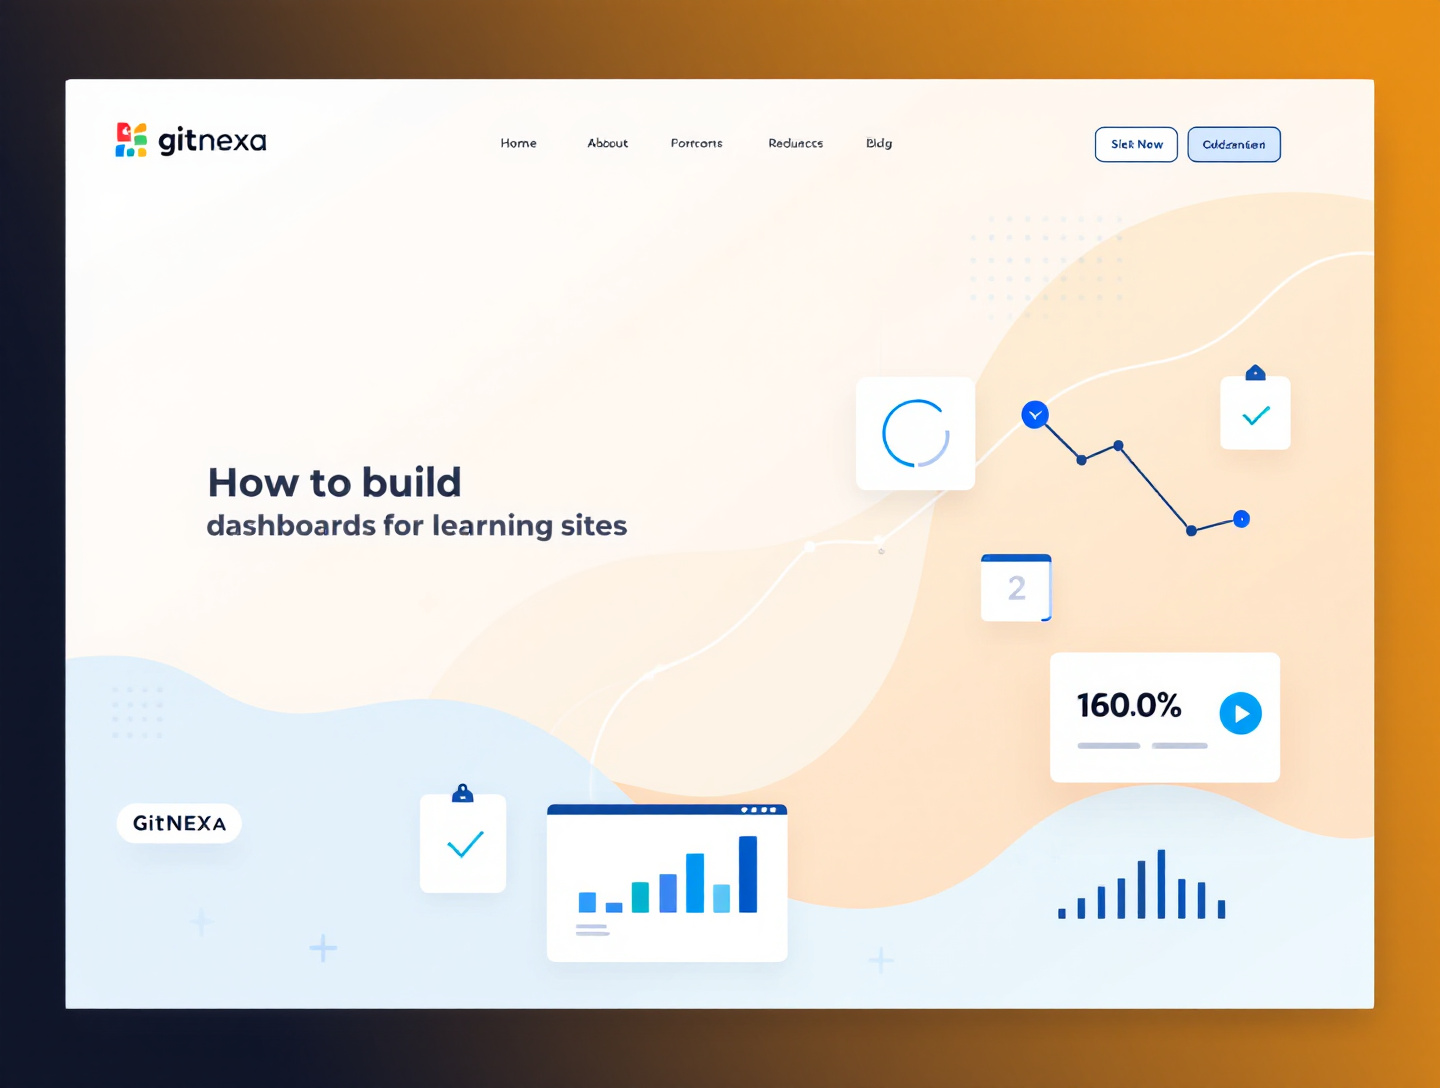
How to Build Student Dashboards for Learning Sites That Convert
Introduction
Online learning platforms live or die by learner engagement. Whether you're building an LMS, a cohort-based course platform, or an enterprise learning portal, the student dashboard is where users spend most of their time. It’s the control center for learning progress, motivation, accountability, and outcomes. Yet many learning sites treat dashboards as an afterthought—resulting in confused learners, low completion rates, and missed business goals.
In this comprehensive guide, you’ll learn how to build student dashboards for learning sites that are intuitive, data-driven, and conversion-focused. We’ll explore real-world use cases, UX principles backed by research, technical architecture, analytics, personalization, accessibility, and performance optimization.
This article is written for EdTech founders, product managers, UX designers, developers, and educators who want to create dashboards that actually improve learning outcomes—not just look good. You'll gain practical frameworks, examples, and best practices you can apply immediately.
By the end, you’ll understand how to design dashboards that:
- Improve learner retention and course completion
- Provide actionable insights for students and instructors
- Scale across multiple courses and user types
- Align with modern SEO, UX, and accessibility standards
Let’s dive deep into building student dashboards that learners love—and Google rewards.
Understanding the Role of Student Dashboards in Learning Platforms
Student dashboards are not just UI components—they are learning enablers. According to Google’s UX research, users form an impression of a product within 50 milliseconds. In learning platforms, that first impression determines whether a student explores or disengages.
What Makes a Student Dashboard Different?
Unlike traditional analytics dashboards, student dashboards blend:
- Pedagogical logic (learning paths, assessments)
- Behavioral psychology (motivation, rewards)
- Real-time analytics (progress, performance)
The dashboard must balance simplicity with depth. Too much data overwhelms learners. Too little leaves them lost.
Core Objectives of a Student Dashboard
- Provide immediate clarity on learning status
- Reduce cognitive load
- Encourage consistent engagement
- Offer actionable next steps
Platforms like Coursera and Khan Academy invest heavily in dashboard UX because they understand its impact on completion rates and user lifetime value.
For more on aligning UX with measurable outcomes, read product-focused UX design best practices.
Defining User Personas and Learning Contexts
Before writing a single line of code, you must define who the dashboard is for.
Common Student Personas
- Self-paced learners
- Cohort-based students
- Corporate trainees
- K–12 students
- University students
Each persona has different expectations, motivations, and tech literacy.
Mapping Dashboards to Learning Models
Self-Paced Learning
- Emphasis on progress tracking
- Resume learning quickly
- Clear milestones
Cohort-Based Learning
- Live session schedules
- Peer activity indicators
- Deadlines and accountability
Enterprise Learning
- Certification status
- Compliance tracking
- Manager visibility
Ignoring context leads to dashboards that try to serve everyone—and help no one.
Core Components of an Effective Student Dashboard
A well-structured student dashboard typically includes the following components:
Learning Progress Overview
- Course completion percentage
- Module-level breakdown
- Visual cues (progress bars, checkmarks)
Next Actions Panel
This is the most important section.
- "Resume Lesson 4"
- "Complete Quiz"
- "Attend Live Session"
Clear CTAs reduce friction and decision fatigue.
Performance Metrics
- Quiz scores
- Assignment grades
- Improvement over time
Avoid ranking students publicly unless your pedagogy supports competition.
Notifications and Alerts
- Upcoming deadlines
- Instructor announcements
- Feedback notifications
Resource Access
- Downloadable materials
- Saved notes
- Discussion forums
For scalable UI systems, see design systems for SaaS platforms.
Information Architecture and Dashboard Layout Strategy
Information architecture (IA) determines how easily students find what they need.
Proven Layout Patterns
- Z-pattern layout for quick scanning
- Hero progress section at the top
- Modular cards for flexibility
Desktop vs Mobile Dashboards
Over 62% of learners access content via mobile devices (Statista).
Design considerations:
- Collapse secondary metrics
- Prioritize tap-friendly CTAs
- Use progressive disclosure
Accessibility-First Layouts
Follow WCAG 2.1 guidelines:
- High contrast ratios
- Keyboard navigation
- Screen reader compatibility
Google explicitly rewards accessible websites in search rankings.
Designing for Motivation and Behavioral Psychology
Learning dashboards should leverage psychology—not manipulate it.
Effective Motivational Elements
- Visual progress indicators
- Achievement badges (used sparingly)
- Streaks and consistency markers
Avoiding Dark Patterns
- No artificial pressure timers
- No deceptive progress inflation
According to Nielsen Norman Group, transparency builds long-term trust—critical in education.
Data Sources and Metrics That Matter
Not all data is useful.
Essential Metrics for Students
- Time spent learning
- Completion status
- Assessment performance
Metrics to Avoid
- Raw engagement counts
- Vanity metrics without context
Real-Time vs Aggregated Data
Use real-time updates only where it adds value (e.g., live sessions).
For scalable analytics pipelines, explore data visualization best practices.
Personalization and Adaptive Dashboards
Personalization increases engagement by up to 20% (McKinsey).
Personalization Techniques
- Adaptive learning paths
- Skill-based recommendations
- Personalized notifications
AI-Driven Dashboards
Machine learning can:
- Predict drop-off risk
- Recommend next lessons
Ensure transparency in AI decisions to maintain trust.
Technical Architecture for Student Dashboards
Frontend Considerations
- React or Vue for dynamic UI
- Component-based architecture
Backend and APIs
- REST or GraphQL APIs
- Role-based access control
Data Storage
- Relational DBs for structured data
- Event-based tracking for analytics
Performance Optimization
- Lazy loading widgets
- Caching frequent queries
For performance tuning, read website performance optimization techniques.
Security and Privacy in Student Dashboards
Compliance Requirements
- GDPR
- FERPA
- COPPA (for minors)
Best Practices
- Data minimization
- Secure authentication
- Audit logs
Google emphasizes trust signals for YMYL (Your Money or Your Life) categories, which include education.
Integrating Dashboards with Instructors and Admins
Dashboards shouldn’t exist in isolation.
Instructor Views
- Student progress overview
- At-risk learners
Admin Dashboards
- Course performance
- Engagement trends
Shared data models reduce redundancy and improve insights.
Real-World Use Cases and Case Studies
Case Study: Online Bootcamp Platform
Problem:
- 40% course drop-off
Solution:
- Introduced next-action focused dashboard
Result:
- 18% increase in completion rates
Case Study: Corporate LMS
- Personalized certification tracking
- Manager visibility
Outcome:
- Improved compliance reporting accuracy
Best Practices for Building Student Dashboards
- Start with user jobs-to-be-done
- Prioritize next actions
- Design mobile-first
- Use data responsibly
- Continuously test and iterate
- Align metrics with learning outcomes
Common Mistakes to Avoid
- Overloading dashboards with data
- Ignoring accessibility
- Treating all learners the same
- Building without analytics validation
- Copying competitors blindly
Frequently Asked Questions
What is the most important feature of a student dashboard?
Clear next actions. Students should instantly know what to do next.
How often should dashboards update?
Only update in real-time when it adds instructional value.
Are gamification elements necessary?
They’re optional and must align with learning goals.
How do dashboards improve SEO?
Better UX increases engagement and reduces bounce rates—positive ranking signals.
Can dashboards be built no-code?
Basic versions can, but scalable platforms require custom development.
What analytics tools work best?
Mix product analytics (like GA4) with learning-specific metrics.
Should dashboards differ by course type?
Yes. Context-driven dashboards perform significantly better.
How do I validate dashboard effectiveness?
Track completion rates, engagement, and qualitative feedback.
Conclusion: The Future of Student Dashboards
Student dashboards are evolving from static status pages to intelligent learning companions. With AI, personalization, and data-driven UX, dashboards will increasingly guide—not just display—learning journeys.
Building effective dashboards requires a blend of pedagogy, design, engineering, and ethics. When done right, they become the backbone of successful learning platforms.
If you’re planning to build or optimize a student dashboard for your learning site, expert guidance can save months of iteration.
Call to Action
Ready to build a high-impact student dashboard tailored to your learning platform? Get expert consultation and a custom roadmap today.
Comments
Loading comments...