Sub Category
Latest Blogs
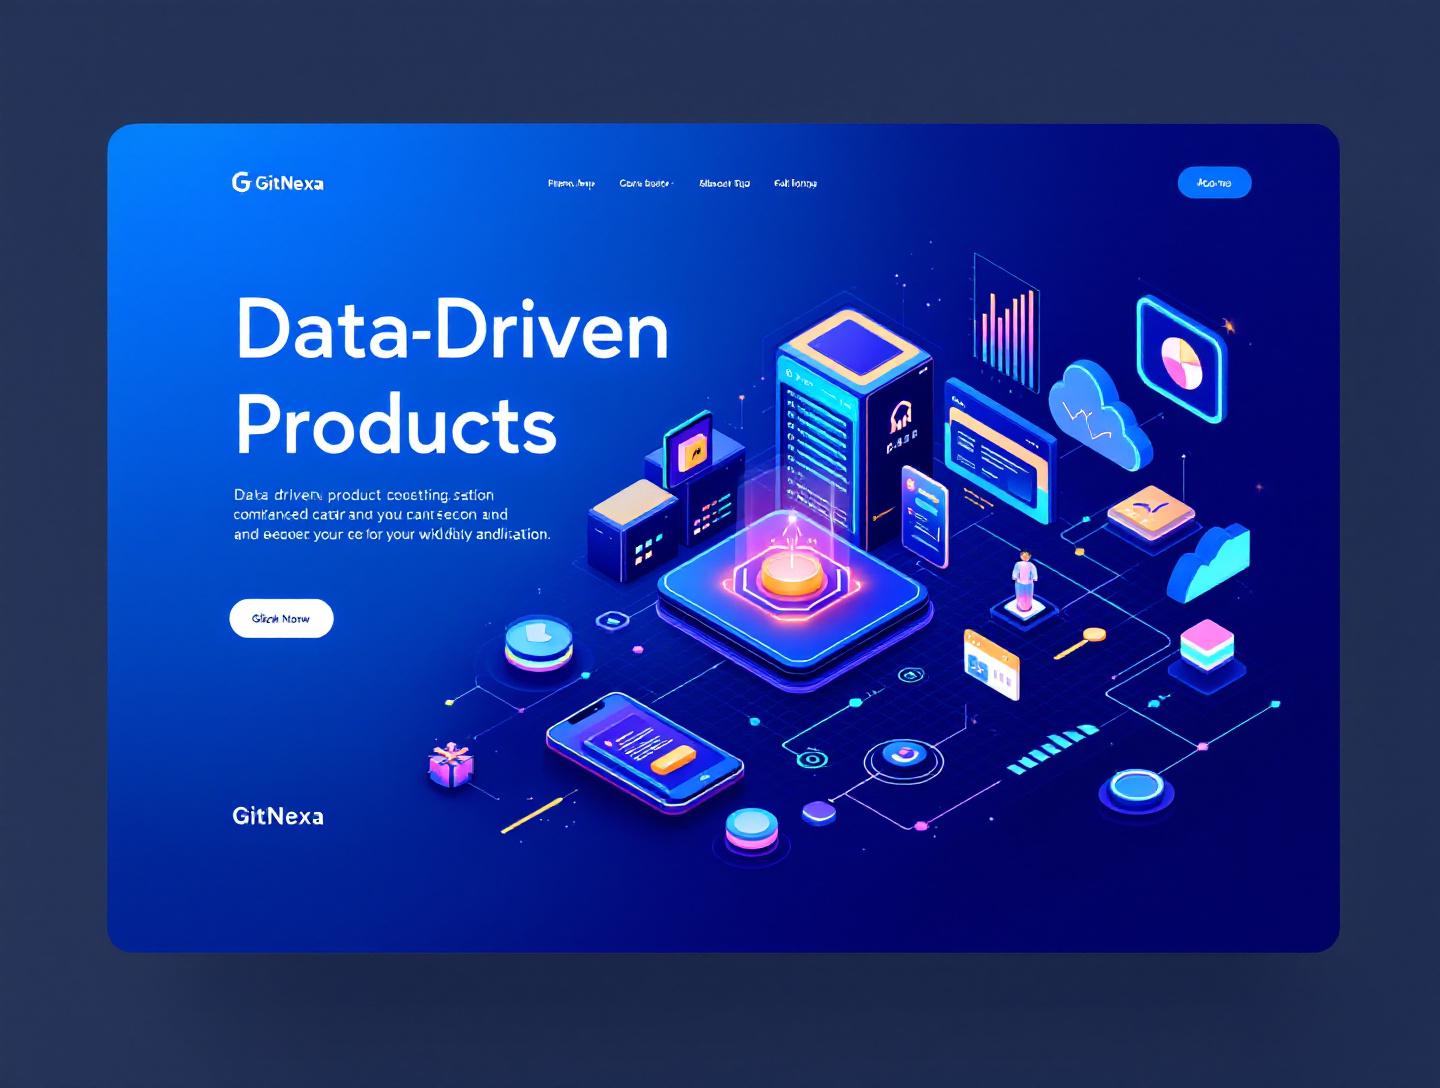
The Ultimate Guide to Data-Driven Product Development
Introduction
In 2024, Productboard surveyed more than 2,000 product leaders and found that 67% of failed products suffered from "building features customers never used." That is not a tooling problem. It is a decision-making problem. Teams ship fast, burn budgets, and still miss the mark because product decisions rely on assumptions, opinions, or the loudest voice in the room. This is exactly where data-driven product development changes the outcome.
Data-driven product development replaces guesswork with evidence. Instead of asking "What do we think users want?" teams ask "What do users actually do, struggle with, and pay for?" When done well, it aligns product strategy, engineering, design, and business goals around a shared source of truth.
If you are a founder trying to reach product-market fit, a CTO scaling a SaaS platform, or a product manager balancing speed with quality, data-driven product development is no longer optional. By 2026, companies that systematically use product analytics and experimentation are expected to outperform peers by over 30%, according to Gartner.
In this guide, you will learn what data-driven product development really means beyond buzzwords, why it matters even more in 2026, and how successful teams structure their data, workflows, and culture around it. We will walk through real-world examples, architecture patterns, and step-by-step processes you can apply immediately. You will also see how GitNexa approaches data-driven product development across web, mobile, cloud, and AI projects.
Let us start with the foundation.
What Is Data-Driven Product Development?
Data-driven product development is a structured approach to building, improving, and scaling products using quantitative and qualitative data at every stage of the product lifecycle. That includes discovery, prioritization, design, development, launch, and iteration.
At its core, it means decisions are validated by evidence rather than intuition alone. Evidence can come from many sources: user behavior analytics, customer interviews, A/B tests, revenue metrics, performance logs, and even support tickets.
Data-Informed vs Data-Driven
This distinction matters more than most teams realize.
- Data-informed teams use data as one input among many. Experience and intuition still dominate.
- Data-driven teams let data set direction, define priorities, and validate outcomes.
In reality, the best teams blend both. Data tells you what is happening and where. Human judgment explains why and what to do next.
The Product Lifecycle Through a Data Lens
Data-driven product development spans the entire lifecycle:
- Discovery: Identify real user problems using interviews, surveys, and behavioral data.
- Validation: Test assumptions with prototypes, MVPs, and experiments.
- Delivery: Measure feature adoption, performance, and usability post-release.
- Optimization: Iterate based on engagement, retention, and conversion metrics.
Each phase feeds the next. Skipping data at any stage introduces blind spots.
Why Data-Driven Product Development Matters in 2026
The product landscape in 2026 looks very different from even three years ago.
Market Saturation and Shorter Attention Spans
Statista reported in 2025 that over 30,000 SaaS products actively compete for attention. Users switch faster, churn sooner, and expect personalization by default. Data-driven product development helps teams detect friction early and adapt before churn becomes irreversible.
AI-Enhanced Products Demand Better Data
AI features are only as good as the data behind them. Whether it is recommendation engines, predictive analytics, or copilots, poor product data leads to unreliable models. Teams building AI-powered products without a strong data foundation often ship impressive demos that collapse in production.
Investor and Stakeholder Expectations
Investors increasingly ask founders for cohort analysis, retention curves, and usage-based metrics. A pitch deck without real product data raises red flags. Data-driven product development turns metrics into strategic assets, not afterthoughts.
Regulatory and Privacy Pressures
With regulations like GDPR, CPRA, and upcoming AI governance frameworks, teams must be deliberate about what data they collect and why. Data-driven does not mean data-hoarding. It means intentional, compliant, and ethical data usage.
Core Metrics That Drive Product Decisions
Understanding North Star Metrics
A North Star Metric represents the core value your product delivers. For Spotify, it is "time spent listening." For Slack, it is "weekly active teams." Choosing the wrong metric leads to local optimizations that hurt long-term growth.
Examples of Strong North Star Metrics
| Product Type | North Star Metric |
|---|---|
| SaaS CRM | Weekly active accounts |
| E-commerce | Repeat purchase rate |
| Mobile App | 7-day retention |
| Marketplace | Successful matches |
Supporting Metrics That Matter
North Star metrics need supporting indicators:
- Activation rate
- Feature adoption
- Churn and retention
- Customer lifetime value (CLV)
- Error rates and performance metrics
Together, these create a balanced view of product health.
Instrumentation: Getting the Data Right
Tools like Amplitude, Mixpanel, and PostHog dominate product analytics in 2026. The key is not the tool, but consistent event naming, clear ownership, and documentation.
analytics.track("Project Created", {
  project_type: "internal",
  user_role: "admin",
  plan: "pro"
});
Poor instrumentation leads to misleading insights, which is worse than no data at all.
Turning User Behavior into Product Insights
Quantitative vs Qualitative Data
Quantitative data shows patterns at scale. Qualitative data explains motivations.
- Analytics tools show drop-off points.
- User interviews explain why users drop.
High-performing teams combine both.
Funnel Analysis and Cohorts
Funnel analysis highlights where users abandon flows like onboarding or checkout. Cohort analysis reveals how different user groups behave over time.
For example, a fintech startup GitNexa worked with discovered that users onboarded via referrals had 22% higher 90-day retention than paid ads. That insight reshaped their acquisition strategy.
Heatmaps and Session Replays
Tools like Hotjar and FullStory expose usability issues that metrics miss. Watching real users struggle with a form field is often more convincing than any chart.
Experimentation and A/B Testing at Scale
When to Experiment
Not every change needs an A/B test. Experiment when:
- The change impacts revenue or retention
- You are choosing between competing solutions
- You want to validate risky assumptions
Designing Meaningful Experiments
A good experiment has:
- A clear hypothesis
- A single variable change
- Defined success metrics
- Statistical significance
Google Optimize was sunset in 2024, pushing teams toward tools like VWO, Optimizely, and in-house frameworks.
Avoiding False Positives
Small sample sizes and short test durations lead to misleading results. GitNexa typically recommends running experiments for at least one full business cycle, often 2–4 weeks.
Data Architecture for Product Teams
Event-Driven Architecture
Modern product data stacks rely on event-driven pipelines.
Client App → Event SDK → Data Warehouse → BI & Analytics
Common stacks include Segment or RudderStack feeding Snowflake or BigQuery, with Looker or Metabase on top.
Real-Time vs Batch Processing
- Real-time data supports personalization and alerts
- Batch processing supports reporting and analysis
Choosing both avoids overengineering while staying responsive.
Data Quality and Governance
Broken pipelines silently kill data-driven cultures. Monitoring, schema validation, and access controls are non-negotiable by 2026 standards.
Aligning Teams Around Data
Product, Engineering, and Design Collaboration
Data should not live only with analysts. Product managers define metrics, engineers instrument events, and designers interpret behavioral patterns.
Shared Dashboards
Single-source dashboards reduce debates. When everyone sees the same numbers, discussions shift from opinions to solutions.
Building a Data Culture
Culture beats tooling. Leadership must reward evidence-based decisions and tolerate experiments that fail for the right reasons.
How GitNexa Approaches Data-Driven Product Development
At GitNexa, data-driven product development starts before the first line of code. During discovery, we map business goals to measurable product outcomes. We help clients define North Star metrics, analytics plans, and experimentation strategies early.
Our teams integrate product analytics into web and mobile applications from day one, whether we are building SaaS platforms, mobile apps, or AI-driven systems. We frequently combine tools like PostHog, BigQuery, and custom dashboards tailored to stakeholder needs.
Across projects, we align data strategy with cloud architecture, DevOps pipelines, and UI/UX decisions. This integrated approach ensures that insights flow continuously, not as quarterly reports. You can see related thinking in our posts on custom software development, UI UX design process, and cloud application architecture.
Common Mistakes to Avoid
- Tracking everything without purpose, leading to noisy dashboards
- Ignoring qualitative feedback in favor of vanity metrics
- Running experiments without statistical rigor
- Failing to document metrics and event definitions
- Making data accessible only to analysts
- Over-optimizing short-term metrics at the expense of retention
Best Practices & Pro Tips
- Start with business outcomes, not tools
- Define metrics before building features
- Review product data weekly, not monthly
- Pair analytics with user interviews
- Sunset metrics that no longer drive decisions
Future Trends & What to Expect
By 2027, expect deeper AI-assisted product analytics, automated experimentation, and stricter data governance. Tools will suggest what to build next, but human judgment will remain essential.
FAQ
What is data-driven product development?
It is an approach where product decisions are guided by user and business data rather than assumptions.
Is data-driven product development only for large companies?
No. Startups benefit even more by avoiding wasted development cycles.
What tools are commonly used?
Amplitude, Mixpanel, PostHog, Segment, and BigQuery are widely used in 2026.
How much data is enough to make decisions?
Enough to reduce uncertainty. Statistical significance matters more than volume.
Can data replace product intuition?
No. Data informs decisions; humans interpret and act.
How often should metrics be reviewed?
Core metrics should be reviewed weekly.
What is a North Star Metric?
A single metric that captures the core value your product delivers.
How long does it take to become data-driven?
Culturally, it takes months. Technically, foundations can be set in weeks.
Conclusion
Data-driven product development is not about dashboards or buzzwords. It is about building products that respond to real user behavior, adapt quickly, and scale sustainably. Teams that commit to evidence-based decisions waste less effort and ship with confidence.
As competition tightens and expectations rise, relying on intuition alone becomes risky. The products that win in 2026 and beyond will be shaped by data, tested through experimentation, and refined through continuous learning.
Ready to build smarter products with data-driven product development? Talk to our team to discuss your project.
Comments
Loading comments...