Sub Category
Latest Blogs
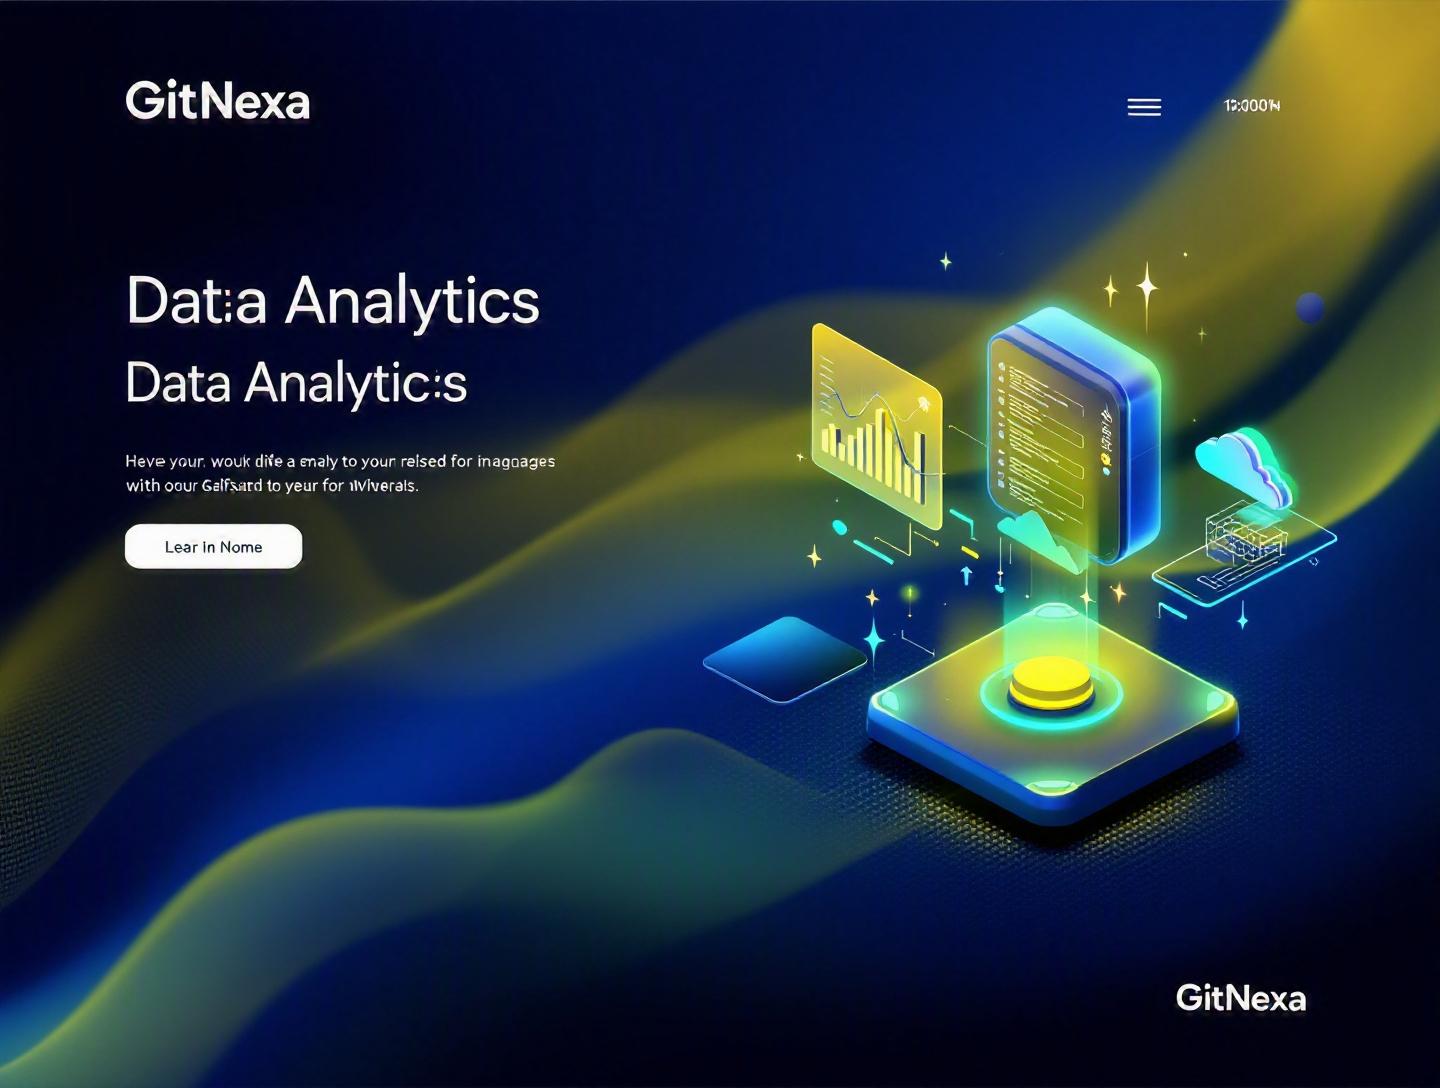
The Ultimate Guide to Data Analytics in Web Applications
Introduction
In 2025, over 90% of enterprise web applications integrate some form of data analytics, according to Gartner. Yet most businesses still struggle to turn raw usage data into meaningful insights. They collect events, clicks, sessions, and transactions—but fail to translate that data into smarter decisions, better UX, or higher revenue.
Data analytics in web applications is no longer optional. It sits at the core of product strategy, personalization, performance optimization, and business growth. Whether you’re running a SaaS platform, an eCommerce store, or an internal enterprise dashboard, your web app generates valuable behavioral and operational data every second.
The problem? Many teams bolt analytics on as an afterthought. They add Google Analytics, maybe a few dashboards, and call it done. But modern web application analytics goes far beyond page views. It includes real-time event tracking, predictive modeling, A/B testing, data pipelines, and machine learning integration.
In this comprehensive guide, you’ll learn what data analytics in web applications really means, why it matters in 2026, how to architect analytics-driven systems, the tools that power them, common mistakes to avoid, and how GitNexa builds analytics-ready platforms for modern businesses.
What Is Data Analytics in Web Applications?
Data analytics in web applications refers to the process of collecting, processing, analyzing, and visualizing data generated by users and systems within a web-based platform.
At a basic level, this includes:
- Page views
- Click events
- Session duration
- Conversion rates
At an advanced level, it includes:
- User journey mapping
- Predictive analytics
- Real-time dashboards
- Behavioral segmentation
- AI-driven recommendations
Types of Analytics in Web Applications
1. Descriptive Analytics
Answers: What happened? Examples: Monthly active users (MAU), bounce rate, revenue per user.
2. Diagnostic Analytics
Answers: Why did it happen? Examples: Funnel drop-off analysis, cohort comparisons.
3. Predictive Analytics
Answers: What will happen next? Examples: Churn prediction models using Python and scikit-learn.
4. Prescriptive Analytics
Answers: What should we do? Examples: Recommendation engines suggesting next-best actions.
Modern analytics stacks often combine tools like:
- Google Analytics 4
- Mixpanel
- Snowflake
- Apache Kafka
- Power BI
- Looker
You can explore how analytics integrates with scalable systems in our guide on cloud-native application development.
Why Data Analytics in Web Applications Matters in 2026
The global big data analytics market is projected to exceed $745 billion by 2030 (Statista, 2024). But the real shift isn’t just market size—it’s expectation.
Users now expect:
- Personalized experiences
- Instant performance
- Intelligent recommendations
- Real-time updates
Key Trends Driving Adoption
- AI-first product design
- Real-time data streaming
- Privacy-first analytics (GDPR, CCPA compliance)
- Edge computing and low-latency processing
For example, Netflix attributes over 80% of watched content to its recommendation system. Amazon uses predictive analytics to optimize inventory and delivery routes. Even mid-size SaaS startups now use churn prediction models to reduce attrition by 10–25%.
Without integrated analytics, product decisions rely on guesswork. With it, decisions become measurable experiments.
Core Components of Data Analytics Architecture in Web Applications
A strong analytics architecture separates data collection, processing, storage, and visualization.
1. Data Collection Layer
Tools: Google Tag Manager, Segment, custom event tracking.
Example event (JavaScript):
analytics.track("Signup Completed", {
  plan: "Pro",
  source: "Landing Page",
  timestamp: new Date()
});
2. Data Ingestion & Streaming
Technologies:
- Apache Kafka
- AWS Kinesis
- Google Pub/Sub
These systems process millions of events per second.
3. Data Storage
| Storage Type | Use Case | Example Tool |
|---|---|---|
| Relational DB | Structured analytics | PostgreSQL |
| Data Warehouse | Large-scale queries | Snowflake |
| Data Lake | Raw unstructured data | Amazon S3 |
4. Data Processing
- Apache Spark
- dbt
- Python ETL pipelines
5. Visualization & BI
- Looker
- Tableau
- Power BI
For scalable backend systems, see our article on microservices architecture best practices.
Implementing Real-Time Analytics in Web Applications
Real-time analytics allows businesses to react instantly.
Use Cases
- Fraud detection
- Live dashboards
- Dynamic pricing
- In-app notifications
Step-by-Step Implementation
- Capture frontend events via WebSockets or HTTP.
- Stream data through Kafka.
- Process with Apache Flink.
- Store in Redis for low-latency access.
- Visualize via a React dashboard.
Example WebSocket snippet:
const socket = new WebSocket("wss://api.example.com/events");
socket.onmessage = (event) => {
  console.log(JSON.parse(event.data));
};
This architecture reduces latency to under 200ms in most cloud setups.
Learn more about scaling infrastructure in our DevOps automation guide.
Personalization & Machine Learning in Web Analytics
Data analytics becomes powerful when paired with machine learning.
Example: Recommendation Engine
- Collect user interaction data
- Store in data warehouse
- Train collaborative filtering model
- Deploy via REST API
Python example:
from sklearn.metrics.pairwise import cosine_similarity
Companies like Spotify use similar systems for playlist recommendations.
For AI integration, read our insights on AI in web development.
Security, Privacy, and Compliance in Analytics
With analytics comes responsibility.
Key Regulations
- GDPR (EU)
- CCPA (California)
- HIPAA (Healthcare)
Best practices:
- Data anonymization
- Encryption at rest (AES-256)
- Role-based access control
Refer to Google’s privacy documentation: https://support.google.com/analytics
Security must be embedded into architecture, not patched later.
How GitNexa Approaches Data Analytics in Web Applications
At GitNexa, we design analytics-ready web applications from day one. Instead of retrofitting dashboards, we integrate event tracking, scalable cloud infrastructure, and BI pipelines during the development phase.
Our approach includes:
- Defining measurable KPIs aligned with business goals
- Designing scalable backend systems (AWS, Azure, GCP)
- Implementing structured event schemas
- Building interactive dashboards using Power BI or Looker
- Ensuring GDPR and CCPA compliance
Whether it's a SaaS analytics dashboard or enterprise reporting system, our team combines expertise in custom web application development and cloud engineering to build intelligent platforms that grow with your business.
Common Mistakes to Avoid
- Tracking too many irrelevant metrics
- Ignoring data governance policies
- Failing to define clear KPIs
- Poor data schema design
- Overloading frontend with analytics scripts
- Not validating data accuracy
- Delayed implementation of analytics
Best Practices & Pro Tips
- Define KPIs before writing tracking code.
- Use event-based tracking over page-based models.
- Normalize data structures early.
- Automate ETL workflows.
- Implement role-based dashboard access.
- Regularly audit tracking scripts.
- Monitor performance impact of analytics libraries.
Future Trends & What to Expect (2026–2027)
- AI-native analytics dashboards
- Voice-driven BI queries
- Edge analytics for IoT web apps
- Zero-party data strategies
- Automated anomaly detection
Gartner predicts that by 2027, 75% of analytics content will be AI-generated insights rather than manual dashboards.
FAQ: Data Analytics in Web Applications
1. What is data analytics in web applications?
It is the process of collecting and analyzing user and system data within web platforms to improve decisions and performance.
2. Which tools are best for web analytics?
Google Analytics 4, Mixpanel, Snowflake, Looker, and Power BI are widely used tools.
3. How do web apps collect user data?
Through event tracking, cookies, APIs, server logs, and third-party integrations.
4. Is real-time analytics necessary?
For fraud detection, personalization, and live monitoring—yes.
5. How do you ensure data privacy?
Use encryption, anonymization, consent management, and regulatory compliance.
6. What is the difference between BI and web analytics?
Web analytics focuses on user behavior; BI covers broader organizational metrics.
7. Can small startups implement analytics?
Yes. Cloud tools make analytics affordable and scalable.
8. How does analytics improve UX?
By identifying friction points and optimizing user flows.
9. What role does AI play in analytics?
AI enables predictive modeling and automated insights.
10. How often should analytics dashboards be reviewed?
Weekly for operations, monthly for strategic planning.
Conclusion
Data analytics in web applications transforms raw activity into measurable growth. From real-time monitoring to AI-powered personalization, analytics sits at the heart of modern digital products. Businesses that embed analytics into architecture—not just dashboards—outperform competitors in user retention, revenue optimization, and product innovation.
If you’re building or scaling a web platform, now is the time to design it with intelligence at its core.
Ready to build a data-driven web application? Talk to our team to discuss your project.
Comments
Loading comments...