Sub Category
Latest Blogs
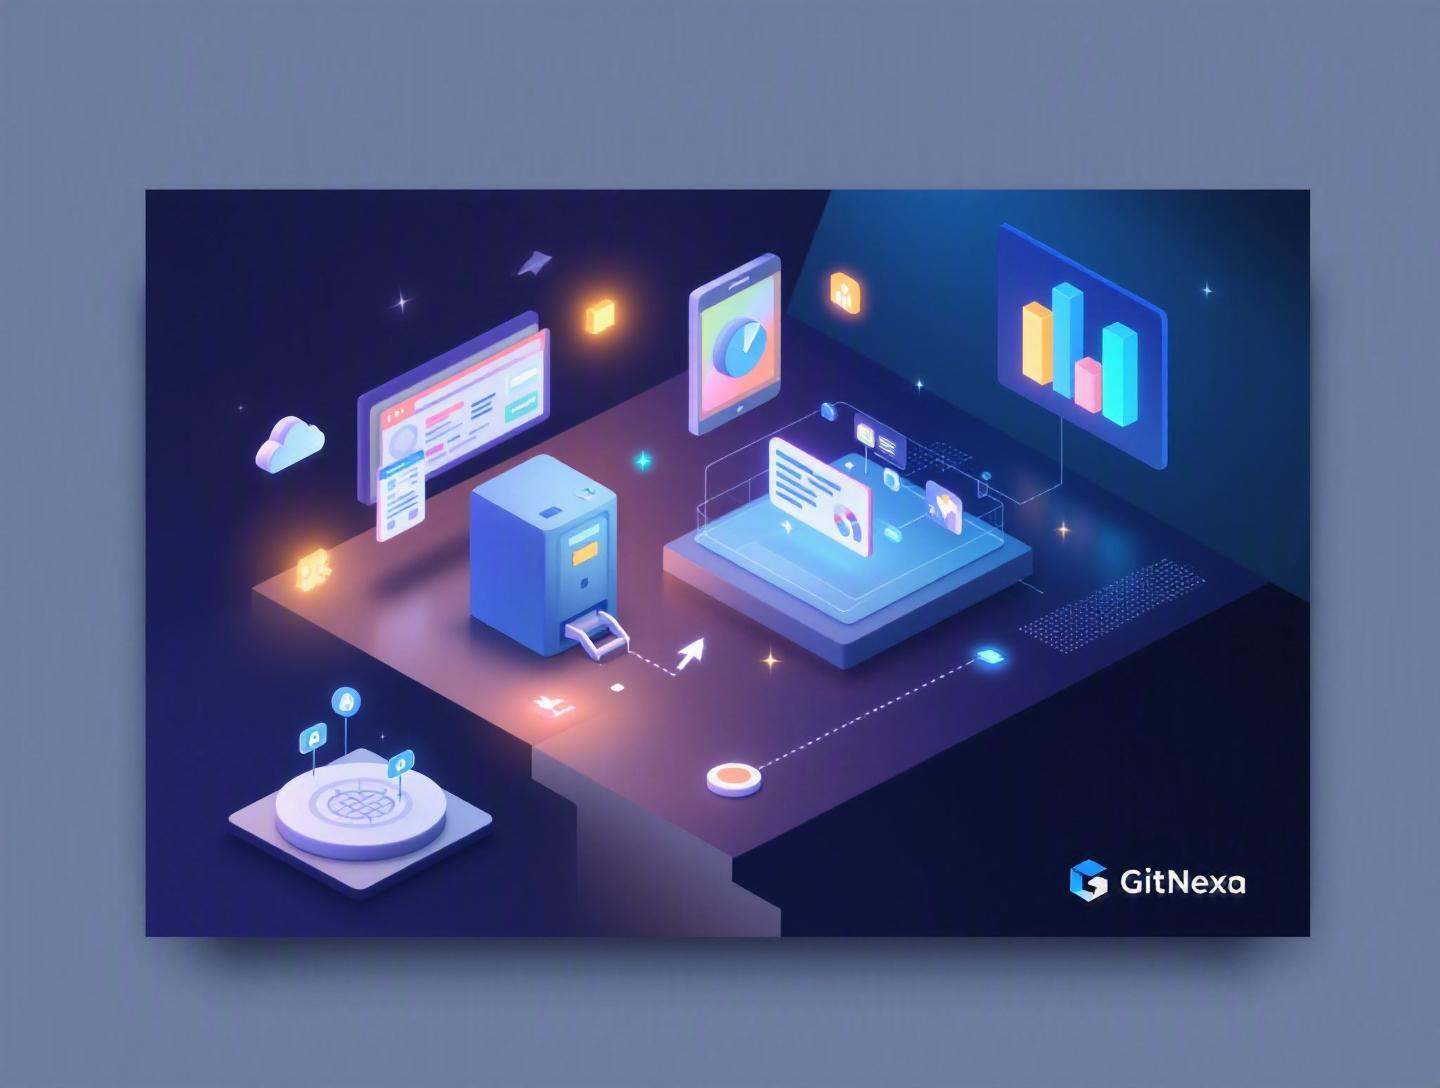
The Ultimate Guide to Restaurant Analytics Systems
Introduction
In 2024, the average full-service restaurant operated on a profit margin of just 3–5%, according to the National Restaurant Association. That means a 2% swing in food cost or labor inefficiency can determine whether a location survives or shuts down. Yet many operators still rely on spreadsheets, disconnected POS exports, and gut instinct. This is where restaurant analytics systems change the game.
A modern restaurant analytics system consolidates data from POS platforms, inventory software, payroll tools, delivery aggregators, and CRM systems into a unified view. Instead of asking, “Why are margins down this month?” owners can see in real time which menu items are underperforming, which shifts are overstaffed, and which promotions actually drive repeat visits.
The problem? Most restaurants collect data—but very few truly analyze it.
In this comprehensive guide, you’ll learn:
- What restaurant analytics systems are and how they work
- Why they matter more than ever in 2026
- Key components, architecture, and implementation strategies
- Real-world use cases and technical examples
- Common mistakes to avoid
- Best practices and future trends
Whether you’re a CTO building a multi-location chain platform, a founder launching a cloud kitchen, or an enterprise group modernizing legacy systems, this guide will help you make smarter, data-driven decisions.
What Is a Restaurant Analytics System?
A restaurant analytics system is a data-driven platform that aggregates, processes, and visualizes operational, financial, and customer data from various restaurant technology systems to support strategic and tactical decision-making.
At its core, it connects multiple data sources:
- POS systems (e.g., Toast, Square, Lightspeed)
- Inventory management tools
- Accounting software (QuickBooks, Xero)
- Payroll and workforce systems
- Online ordering platforms (Uber Eats, DoorDash)
- CRM and loyalty platforms
- Reservation systems (OpenTable, Resy)
The system then transforms raw data into actionable insights through dashboards, KPIs, alerts, and predictive analytics.
Core Capabilities
1. Operational Analytics
Tracks table turnover, order preparation time, kitchen performance, and labor utilization.
2. Financial Analytics
Monitors revenue, gross margin, food cost percentage, labor cost ratio, and contribution margin by item.
3. Customer Analytics
Analyzes repeat visit rate, average ticket size, customer lifetime value (CLV), and campaign performance.
4. Predictive & Prescriptive Analytics
Uses machine learning to forecast demand, optimize inventory ordering, and recommend staffing levels.
Restaurant Analytics vs. Traditional Reporting
| Feature | Traditional Reporting | Restaurant Analytics Systems |
|---|---|---|
| Data Frequency | Daily/Weekly | Real-time or near real-time |
| Integration | Manual exports | Automated integrations |
| Insights | Historical | Predictive & prescriptive |
| Visualization | Static spreadsheets | Interactive dashboards |
| Decision Speed | Slow | Immediate |
Traditional reporting tells you what happened. Restaurant analytics systems tell you why it happened—and what to do next.
Why Restaurant Analytics Systems Matter in 2026
The restaurant industry has transformed dramatically over the past five years.
According to Statista (2025), the global food service market surpassed $4.3 trillion, driven by digital ordering, delivery platforms, and hybrid dining models. Meanwhile, labor shortages and rising ingredient costs continue to squeeze margins.
1. Multi-Channel Complexity
A single restaurant now generates revenue from:
- Dine-in
- Takeout
- Third-party delivery
- First-party online ordering
- Catering
- Subscription meal programs
Each channel has different margins and cost structures. Without centralized analytics, you’re guessing which channel is actually profitable.
2. Rising Food Costs
US food prices increased by 4.1% in 2025 (USDA data). Even small forecasting errors lead to spoilage or stockouts.
Advanced restaurant analytics systems use demand forecasting algorithms to align purchasing with historical sales and seasonality.
3. Labor Optimization
Labor often accounts for 30–35% of total revenue. Workforce analytics can reduce overstaffing during slow shifts and prevent understaffing during peak hours.
4. Data-Driven Consumers
Personalized offers, loyalty rewards, and dynamic pricing require customer analytics. Generic promotions don’t cut it anymore.
5. Investor Expectations
Private equity and venture-backed chains demand performance dashboards across locations. Real-time KPI visibility isn’t optional—it’s expected.
In short, restaurant analytics systems are no longer “nice to have.” They’re operational infrastructure.
Architecture of Modern Restaurant Analytics Systems
Let’s get technical.
A scalable restaurant analytics system typically follows a layered architecture.
High-Level Architecture
[POS] [Inventory] [CRM] [Delivery APIs]
        |         |        |
        -------- Data Ingestion --------
                     |
                Data Warehouse
             (Snowflake / BigQuery)
                     |
          ETL / ELT (dbt, Airflow)
                     |
            Analytics & BI Layer
         (Power BI, Tableau, Metabase)
                     |
            Dashboards & Alerts
1. Data Ingestion Layer
APIs and webhooks pull data from systems like Toast or Square.
Example API call (Node.js):
const axios = require('axios');

async function fetchSalesData() {
  const response = await axios.get('https://api.toasttab.com/sales/v2/orders', {
    headers: {
      Authorization: `Bearer ${process.env.TOAST_API_KEY}`
    }
  });
  return response.data;
}
This data is normalized and stored in staging tables.
2. Data Warehouse
Cloud data warehouses like Google BigQuery or Snowflake allow high-performance queries across millions of transactions.
Benefits:
- Scalable storage
- Columnar architecture
- Fast analytical queries
3. Data Transformation
Tools like dbt transform raw transactional data into analytics-ready models.
Example model:
SELECT
  item_name,
  SUM(quantity) AS total_sold,
  SUM(total_price) AS total_revenue,
  SUM(cost) AS total_cost,
  SUM(total_price - cost) AS gross_profit
FROM orders
GROUP BY item_name;
4. Analytics & Visualization
BI tools present KPIs like:
- Food cost %
- Prime cost (labor + food)
- Revenue per seat
- Average order value (AOV)
For organizations building custom dashboards, our experience in cloud application development becomes essential for scalability.
Core Use Cases of Restaurant Analytics Systems
Now let’s look at how restaurant analytics systems create measurable impact.
1. Menu Engineering & Profit Optimization
Menu engineering categorizes items into:
- Stars (high profit, high popularity)
- Plowhorses (low profit, high popularity)
- Puzzles (high profit, low popularity)
- Dogs (low profit, low popularity)
Example
A regional burger chain discovered that a "Signature Truffle Burger" generated 18% margin compared to 32% for a simpler "Classic Smash." After analyzing contribution margins, they repositioned menu placement and adjusted pricing—boosting overall gross margin by 4.3% in one quarter.
Step-by-Step Process
- Extract item-level sales and cost data.
- Calculate contribution margin per item.
- Rank by popularity.
- Visualize in a quadrant matrix.
- Adjust pricing or promotion accordingly.
2. Demand Forecasting & Inventory Management
Food waste costs US restaurants billions annually.
Predictive analytics models use:
- Historical sales
- Seasonality
- Weather data
- Local events
Example forecasting formula (simplified):
from sklearn.ensemble import RandomForestRegressor
model = RandomForestRegressor()
model.fit(X_train, y_train)
predictions = model.predict(X_test)
A cloud kitchen in Chicago reduced food waste by 22% after implementing ML-driven demand forecasting.
This aligns closely with modern AI-powered business solutions.
3. Labor Cost Optimization
Labor analytics can answer:
- Are managers scheduling based on intuition or data?
- Which shifts consistently exceed revenue-to-labor ratios?
Target metric: Labor cost under 30–32% of revenue (varies by concept).
By integrating POS sales velocity with workforce systems, restaurants dynamically adjust staffing.
One QSR chain cut overtime expenses by $480,000 annually after implementing shift-level performance dashboards.
4. Multi-Location Performance Benchmarking
For chains, standardization is critical.
Restaurant analytics systems allow:
- Location-level comparisons
- Regional trend analysis
- KPI anomaly detection
Example Dashboard Metrics:
- Revenue per square foot
- Food cost variance by region
- Staff turnover rate
This requires scalable backend architecture, similar to approaches described in our enterprise web application development.
5. Customer Analytics & Loyalty Insights
Customer retention is cheaper than acquisition. According to Bain & Company, increasing retention by 5% can increase profits by 25–95%.
With CRM integration, restaurant analytics systems measure:
- Repeat purchase rate
- Visit frequency
- Campaign ROI
- Customer lifetime value
Example: A sushi chain identified that customers who ordered via app 3+ times per month had 2.4x higher lifetime value. They introduced app-exclusive bundles and saw a 17% revenue increase.
For mobile-first strategies, strong restaurant mobile app development becomes essential.
Implementation Roadmap for Restaurant Analytics Systems
Building or adopting restaurant analytics systems requires structured planning.
Step 1: Define KPIs
Common KPIs:
- Prime cost
- AOV
- Revenue per labor hour
- Inventory turnover ratio
Step 2: Audit Existing Tech Stack
Identify:
- API availability
- Data formats
- Real-time vs batch exports
Step 3: Choose Architecture
| Approach | Pros | Cons |
|---|---|---|
| Off-the-shelf analytics | Faster deployment | Limited customization |
| Custom-built system | Tailored insights | Higher upfront cost |
| Hybrid | Balanced | Requires integration expertise |
Step 4: Build Data Pipelines
Use tools like:
- Apache Airflow
- AWS Glue
- Fivetran
Our experience with DevOps automation ensures reliable CI/CD for analytics infrastructure.
Step 5: Deploy Dashboards & Train Staff
Data without adoption is useless. Managers must understand metrics and how to act on them.
How GitNexa Approaches Restaurant Analytics Systems
At GitNexa, we approach restaurant analytics systems as scalable digital infrastructure—not just reporting tools.
First, we conduct a data maturity assessment. Many restaurant groups have fragmented systems across locations. We map every data source, evaluate API readiness, and define measurable business outcomes.
Second, we design cloud-native architectures using platforms like AWS, Azure, or Google Cloud. Our team builds secure data pipelines, implements warehouse models, and integrates BI tools tailored to stakeholder needs.
Third, we focus on usability. A dashboard is only effective if managers actually use it. Through strong UI/UX design principles, we create intuitive analytics interfaces for operations teams.
Finally, we incorporate AI-driven forecasting and automation where it creates real ROI—inventory optimization, labor scheduling, and customer segmentation.
The result? A restaurant analytics system that supports growth across multiple locations without adding operational chaos.
Common Mistakes to Avoid
1. Tracking Too Many KPIs
More data isn’t better. Focus on 8–12 core metrics aligned with business goals.
2. Ignoring Data Quality
Duplicate entries, inconsistent item names, and missing timestamps distort insights.
3. Failing to Integrate Delivery Platforms
Ignoring Uber Eats or DoorDash skews revenue analysis.
4. Not Training Managers
Dashboards don’t drive change—people do.
5. Overlooking Security & Compliance
Payment data and customer information must comply with PCI DSS and privacy laws.
6. Choosing Tools Without API Access
Closed systems create future bottlenecks.
7. Delaying Iteration
Analytics systems should evolve with menu changes and new revenue streams.
Best Practices & Pro Tips
- Start with Prime Cost Optimization – It’s the fastest way to improve margins.
- Automate Data Syncs – Eliminate manual CSV uploads.
- Benchmark Weekly, Not Monthly – Faster reaction cycles.
- Use Cohort Analysis for Loyalty Programs – Track retention over time.
- Implement Real-Time Alerts – Notify managers when food cost exceeds threshold.
- Standardize Naming Conventions – Clean data structure simplifies modeling.
- Align Incentives with KPIs – Tie bonuses to measurable performance.
- Test Before Scaling – Pilot analytics in 1–2 locations.
Future Trends & What to Expect (2026–2027)
Restaurant analytics systems will become more autonomous and AI-driven.
1. AI-Powered Dynamic Pricing
Menu prices may adjust based on demand, time of day, or ingredient cost volatility.
2. Real-Time IoT Integration
Smart kitchen equipment feeding usage data into analytics dashboards.
3. Computer Vision in Kitchens
Tracking prep time and quality control through vision models.
4. Voice-Activated Dashboards
"Show me yesterday’s labor cost percentage"—powered by LLM-based analytics assistants.
5. Hyper-Personalized Offers
AI-driven customer segmentation with predictive churn modeling.
According to Gartner (2025), over 60% of enterprise analytics platforms will incorporate embedded AI by 2027.
FAQ: Restaurant Analytics Systems
1. What are restaurant analytics systems used for?
They centralize operational, financial, and customer data to improve decision-making, reduce costs, and increase profitability.
2. How much do restaurant analytics systems cost?
Costs range from $200–$1,000/month for SaaS tools to custom solutions exceeding $50,000 depending on complexity.
3. Can small restaurants benefit from analytics systems?
Yes. Even single-location restaurants can optimize inventory and labor with basic analytics dashboards.
4. How do analytics systems integrate with POS platforms?
Most modern POS systems provide APIs or webhooks for data extraction.
5. What KPIs should restaurants track?
Prime cost, food cost percentage, labor cost ratio, AOV, and repeat visit rate are foundational metrics.
6. Are restaurant analytics systems secure?
When built with proper encryption and compliance standards (PCI DSS, GDPR), they are secure.
7. How long does implementation take?
Off-the-shelf tools can be deployed in weeks. Custom systems may take 3–6 months.
8. What’s the difference between BI tools and analytics systems?
BI tools visualize data. Analytics systems include data integration, transformation, modeling, and predictive insights.
9. Can AI improve restaurant forecasting?
Yes. Machine learning models significantly improve demand forecasting accuracy.
10. Do restaurant analytics systems work for cloud kitchens?
Absolutely. They are especially useful for delivery-first, multi-brand virtual kitchens.
Conclusion
Margins in the restaurant industry are razor-thin. Guesswork is expensive. Restaurant analytics systems provide the visibility, forecasting power, and operational intelligence needed to compete in 2026 and beyond.
From menu engineering and labor optimization to customer segmentation and multi-location benchmarking, the right analytics infrastructure turns raw data into measurable profit growth.
If you’re ready to build or modernize your restaurant analytics systems, now is the time to act.
Ready to transform your restaurant data into actionable insights? Talk to our team to discuss your project.
Comments
Loading comments...