Sub Category
Latest Blogs
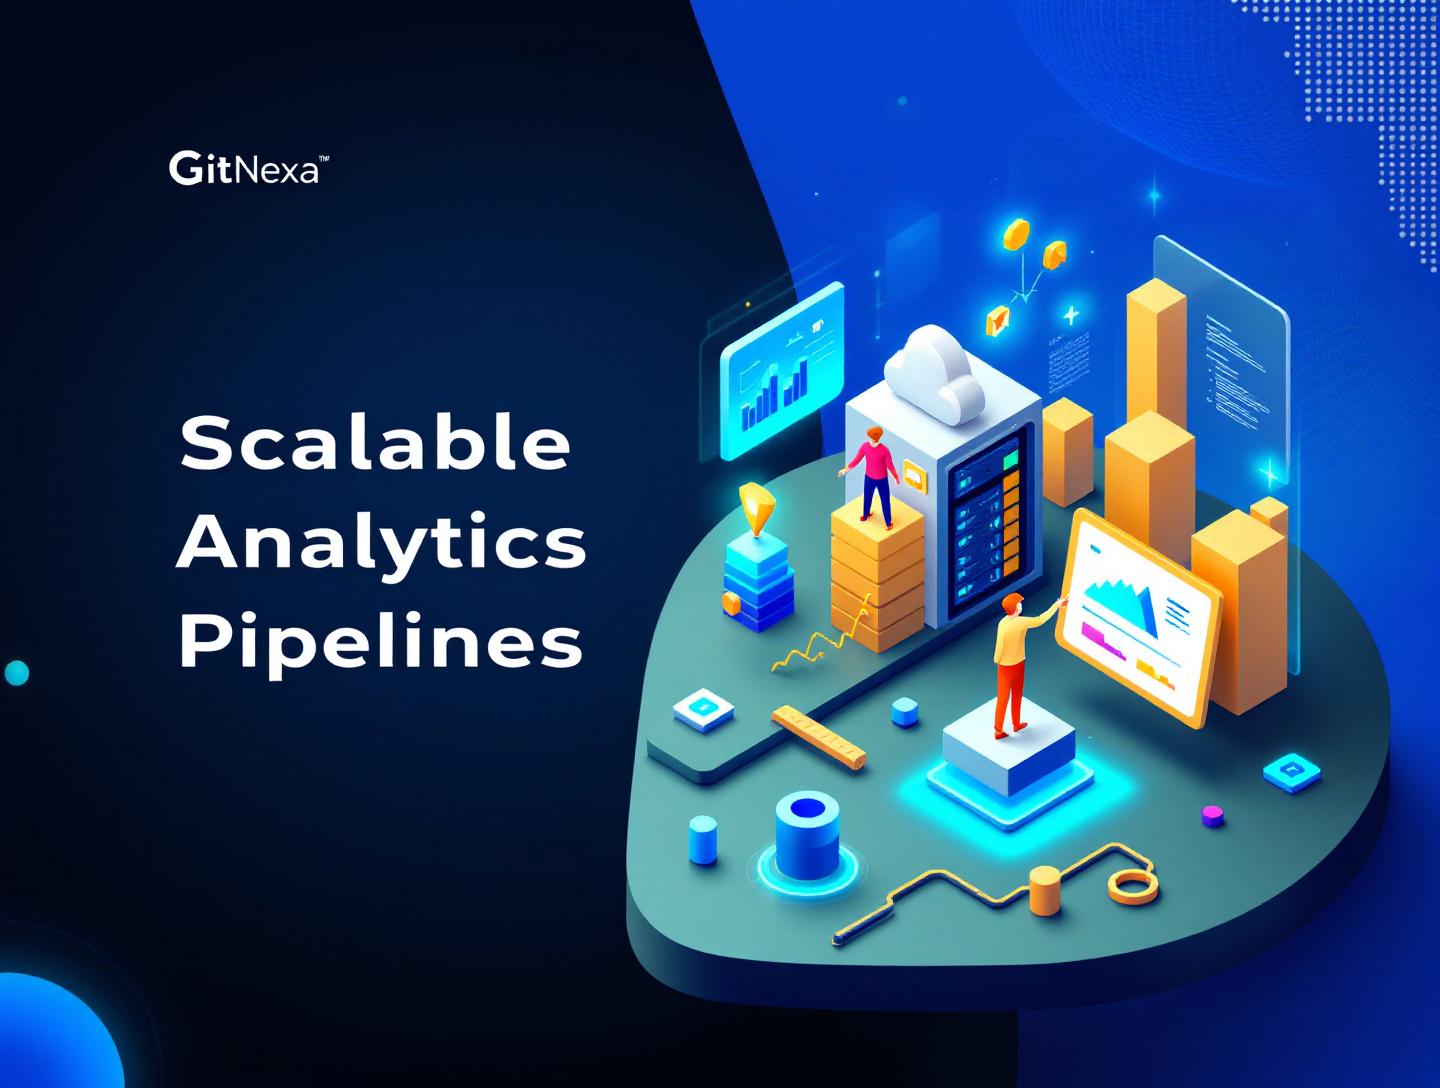
The Ultimate Guide to Building Scalable Analytics Pipelines
Introduction
In 2025, the world generated over 181 zettabytes of data, according to IDC. By 2026, that number is expected to exceed 200 zettabytes. Yet most organizations still struggle to extract reliable, real-time insights from their data. The challenge isn’t collecting data anymore — it’s building scalable analytics pipelines that can ingest, process, store, and analyze that data without breaking under pressure.
Building scalable analytics pipelines has become a mission-critical capability for startups, enterprises, SaaS companies, fintech platforms, healthcare providers, and ecommerce businesses alike. Whether you're processing millions of events per minute or training machine learning models on terabytes of behavioral data, your pipeline architecture determines whether your analytics are trustworthy — or a liability.
In this comprehensive guide, we’ll break down what scalable analytics pipelines are, why they matter in 2026, and how to design them correctly. We’ll explore architecture patterns, batch vs. streaming tradeoffs, tooling decisions, cost optimization strategies, governance frameworks, and real-world implementation examples. We’ll also share how GitNexa approaches building production-grade data systems for growing companies.
If you’re a CTO, data engineer, startup founder, or product leader looking to design analytics infrastructure that grows with your business, this guide is for you.
What Is Building Scalable Analytics Pipelines?
Building scalable analytics pipelines means designing systems that can ingest, transform, validate, and store large volumes of data reliably — while maintaining performance as data grows.
At its core, an analytics pipeline includes:
- Data ingestion – Collecting data from sources (APIs, databases, IoT devices, logs, apps).
- Data processing – Cleaning, transforming, aggregating, and enriching data.
- Storage – Storing structured or semi-structured data (data lakes, warehouses).
- Serving layer – Making data available for BI tools, dashboards, ML models, or APIs.
A scalable analytics pipeline differs from a simple ETL script in three major ways:
- It handles exponential data growth.
- It supports distributed computing.
- It ensures reliability, fault tolerance, and observability.
For example, Netflix processes petabytes of data daily using Apache Kafka and Spark. Shopify processes billions of events across its ecommerce platform. These companies don’t rely on cron jobs and SQL scripts — they rely on distributed, resilient data infrastructure.
In modern systems, scalable pipelines often include tools such as:
- Apache Kafka (event streaming)
- Apache Spark or Flink (distributed processing)
- Snowflake or BigQuery (cloud data warehouses)
- Airflow or Prefect (workflow orchestration)
- dbt (transformation modeling)
Scalability isn’t just about volume — it’s about concurrency, velocity, and cost efficiency.
Why Building Scalable Analytics Pipelines Matters in 2026
The analytics landscape has changed dramatically.
According to Gartner (2025), 75% of enterprises now operate hybrid or multi-cloud data environments. Meanwhile, real-time analytics adoption has increased by 40% since 2022. Businesses want instant insights — not overnight batch reports.
Here’s why scalable analytics pipelines are non-negotiable in 2026:
1. AI and Machine Learning Depend on Clean Data
Modern ML systems rely on high-quality training data. Poor pipelines lead to model drift, inaccurate predictions, and compliance risks.
2. Real-Time Decision Making
Fraud detection, personalization, and dynamic pricing require millisecond-level processing.
3. Regulatory Compliance
GDPR, HIPAA, and evolving AI regulations demand traceability and auditability.
4. Cost Optimization
Cloud storage and compute bills can spiral without efficient data architecture.
If your data stack cannot scale horizontally, handle schema evolution, or provide observability, growth will eventually expose its weaknesses.
Architecture Patterns for Scalable Analytics Pipelines
Let’s examine the core architecture patterns used today.
Lambda Architecture
Combines batch and real-time layers.
Data Sources → Batch Layer (HDFS/S3 + Spark)
            → Speed Layer (Kafka + Flink)
            → Serving Layer (Warehouse)
Pros: Accurate and resilient
Cons: Operationally complex
Kappa Architecture
Processes everything as a stream.
Data Sources → Kafka → Stream Processor → Storage
Pros: Simpler than Lambda
Cons: Less ideal for heavy historical reprocessing
Lakehouse Architecture
Popularized by Databricks.
Combines data lakes (cheap storage) with warehouse features (ACID transactions).
| Feature | Data Lake | Data Warehouse | Lakehouse |
|---|---|---|---|
| Storage Cost | Low | Medium | Low |
| Schema Enforcement | Weak | Strong | Strong |
| Scalability | High | High | High |
| ACID Transactions | No | Yes | Yes |
Lakehouse solutions like Delta Lake and Apache Iceberg are now common in scalable analytics pipelines.
For cloud-native architecture insights, see our guide on cloud-native application development.
Batch vs. Real-Time Data Processing
A common mistake is assuming you need real-time processing for everything.
Batch Processing
Best for:
- Financial reports
- Monthly KPIs
- Historical data aggregation
Tools: Apache Spark, AWS Glue, BigQuery scheduled queries.
Real-Time Processing
Best for:
- Fraud detection
- Recommendation engines
- Monitoring systems
Tools: Kafka, Flink, AWS Kinesis.
Hybrid Approach (Recommended)
Many companies use:
- Kafka for ingestion
- Spark for batch transformation
- dbt for modeling
- Snowflake for analytics
For DevOps strategies that support real-time data systems, explore DevOps best practices.
Step-by-Step: Designing a Scalable Analytics Pipeline
Here’s a practical implementation roadmap.
Step 1: Define Data Contracts
Establish schemas using tools like:
- Avro
- Protobuf
- JSON Schema
Version them properly.
Step 2: Choose Scalable Ingestion
Use distributed messaging systems:
from kafka import KafkaProducer
producer = KafkaProducer(bootstrap_servers='localhost:9092')
producer.send('events', b'user_signup')
Step 3: Implement Transformation Layer
Use dbt for modular SQL transformations.
Example dbt model:
SELECT user_id,
       COUNT(*) AS total_events
FROM {{ ref('raw_events') }}
GROUP BY user_id
Step 4: Optimize Storage
Partition large tables by date or region.
Step 5: Add Observability
Monitor with:
- Prometheus
- Grafana
- Datadog
For production monitoring, read our article on building scalable web applications.
Data Governance, Security & Compliance
Scalability without governance is dangerous.
Key Components:
- Role-Based Access Control (RBAC)
- Data lineage tracking
- Encryption at rest and in transit
- Audit logging
Tools like Apache Atlas and Collibra help manage metadata.
According to IBM’s 2024 Cost of a Data Breach Report, the global average breach cost reached $4.45 million. Secure pipelines reduce risk significantly.
For enterprise-grade systems, we often combine governance with enterprise cloud migration strategies.
Cost Optimization Strategies
Cloud analytics costs scale fast.
Practical Tips:
- Use auto-scaling clusters.
- Separate storage and compute.
- Archive cold data to cheaper tiers.
- Optimize queries using partition pruning.
Example BigQuery partition filter:
WHERE event_date BETWEEN '2026-01-01' AND '2026-01-31'
FinOps practices are now essential in scalable analytics pipeline design.
How GitNexa Approaches Building Scalable Analytics Pipelines
At GitNexa, we approach building scalable analytics pipelines with long-term growth in mind. We start with a detailed data maturity assessment: volume projections, compliance requirements, latency expectations, and cost modeling.
Our architecture team designs cloud-native, modular pipelines using tools such as Kafka, Spark, Snowflake, and dbt. For startups, we build lean systems that can scale without re-architecture. For enterprises, we implement multi-region redundancy and governance frameworks.
We integrate analytics pipelines with broader initiatives such as AI and machine learning solutions and custom software development.
The goal is simple: build once, scale confidently.
Common Mistakes to Avoid
- Ignoring schema evolution.
- Over-engineering real-time systems unnecessarily.
- Skipping monitoring and alerting.
- Not planning for cost growth.
- Tight coupling between ingestion and processing layers.
- Poor documentation of data lineage.
- Lack of disaster recovery planning.
Best Practices & Pro Tips
- Design for horizontal scalability from day one.
- Separate storage and compute.
- Automate data quality checks.
- Use Infrastructure as Code (Terraform).
- Implement CI/CD for data pipelines.
- Adopt a lakehouse architecture for flexibility.
- Document everything.
Future Trends & What to Expect (2026–2027)
- Rise of serverless analytics (BigQuery, Athena).
- Data mesh adoption in large enterprises.
- AI-driven data quality monitoring.
- Real-time analytics as default.
- Increased regulatory scrutiny on AI training data.
As tools mature, complexity shifts from infrastructure to governance and orchestration.
FAQ: Building Scalable Analytics Pipelines
What is a scalable analytics pipeline?
A system designed to ingest, process, and analyze growing volumes of data without performance degradation.
Which tools are best for scalable data pipelines?
Kafka, Spark, Snowflake, BigQuery, and dbt are widely used in production systems.
How do I make my pipeline fault-tolerant?
Use distributed systems with replication, retries, checkpointing, and monitoring.
What’s the difference between ETL and ELT?
ETL transforms data before loading; ELT transforms after loading into a warehouse.
Is real-time analytics always necessary?
No. Many use cases work efficiently with batch processing.
How do I reduce cloud analytics costs?
Partition tables, optimize queries, use auto-scaling, and archive cold data.
What is data mesh?
A decentralized approach where teams own their data products.
How long does it take to build a scalable pipeline?
Depending on complexity, 6–16 weeks for production-grade systems.
Conclusion
Building scalable analytics pipelines is no longer optional — it’s foundational. From ingestion and processing to governance and cost optimization, every architectural decision shapes how your business extracts value from data. The right approach balances performance, reliability, and long-term scalability.
Whether you're handling gigabytes or petabytes, the principles remain the same: modular design, distributed systems, strong governance, and proactive monitoring.
Ready to build scalable analytics pipelines that grow with your business? Talk to our team to discuss your project.
Comments
Loading comments...