Sub Category
Latest Blogs
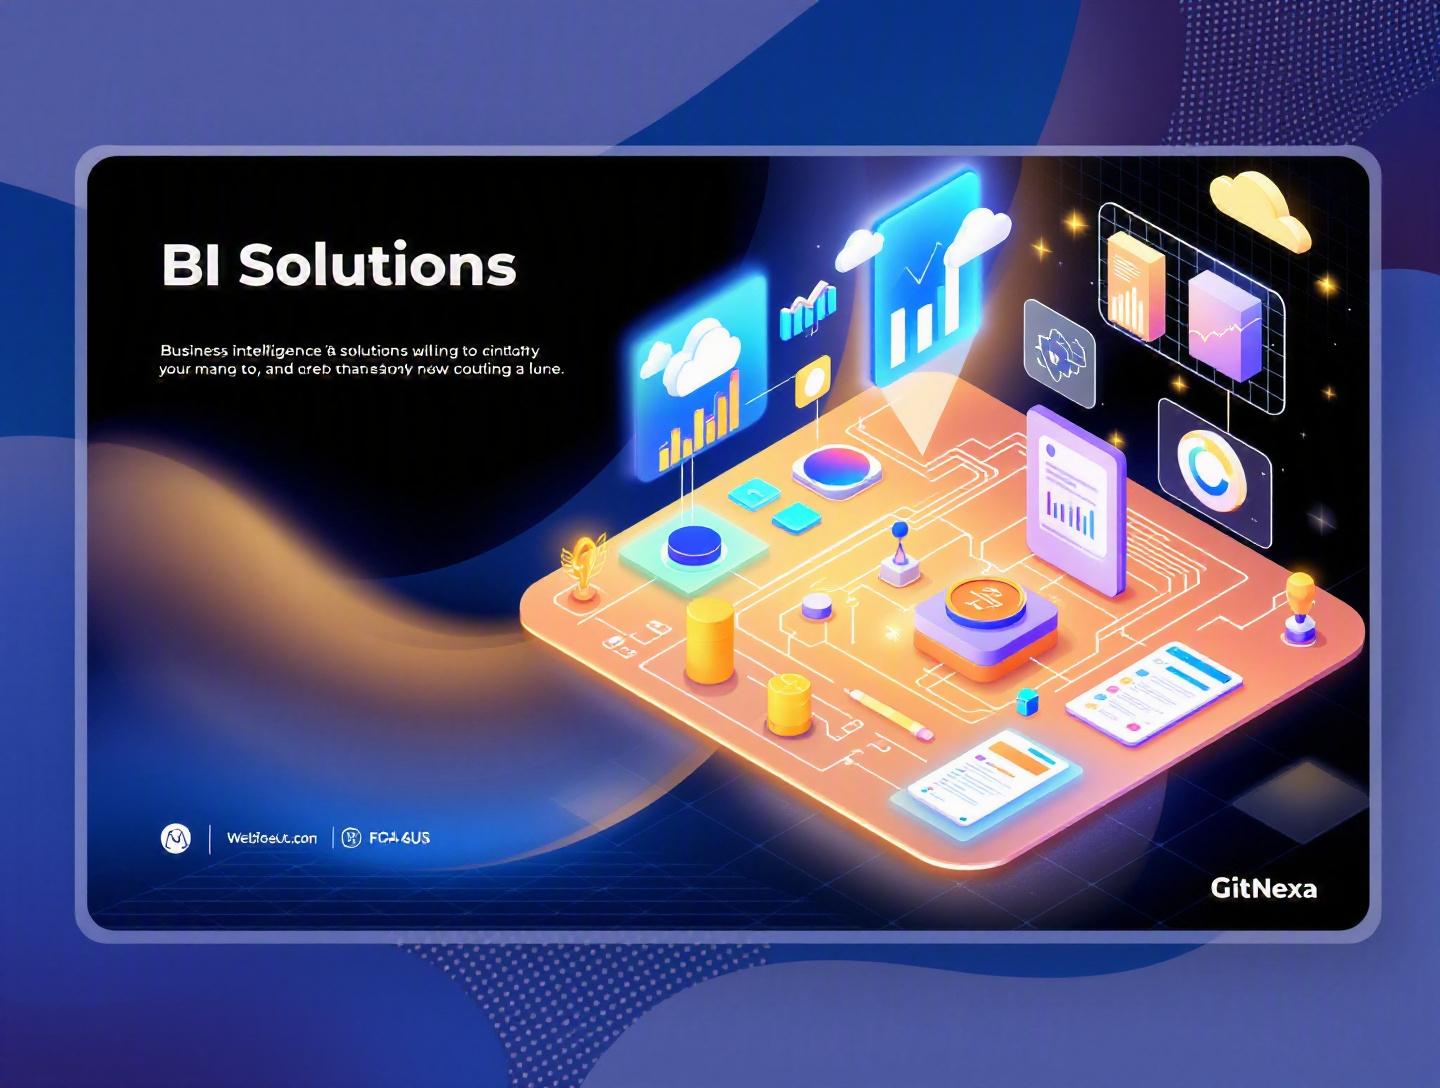
Ultimate Guide to Business Intelligence Solutions
Introduction
In 2025, IDC estimated that global data creation would surpass 175 zettabytes. Yet, according to Gartner, over 70% of enterprise data still goes unused for analytics. That gap between data collection and actual decision-making is where business intelligence solutions earn their keep.
Companies today track everything: customer behavior, marketing attribution, operational metrics, supply chain performance, and financial forecasts. But raw data doesn’t drive revenue. Insight does. The problem? Most organizations are drowning in dashboards, disconnected spreadsheets, and siloed systems. Executives don’t trust the numbers. Teams waste hours reconciling reports. Strategic decisions rely on gut feeling instead of evidence.
This is where modern business intelligence solutions step in. They consolidate data from multiple sources, transform it into meaningful insights, and present it through intuitive dashboards and analytics tools. Done right, BI becomes the nervous system of an organization — constantly feeding leadership with real-time signals.
In this guide, we’ll break down what business intelligence solutions really are, why they matter in 2026, the architecture behind them, tools worth considering, implementation strategies, common pitfalls, and what the future holds. Whether you’re a CTO planning a data platform overhaul or a founder exploring analytics for the first time, this deep dive will give you clarity and direction.
What Is Business Intelligence Solutions?
Business intelligence solutions refer to the combination of technologies, processes, and practices used to collect, integrate, analyze, and visualize business data to support informed decision-making.
At a high level, BI solutions typically include:
- Data integration (ETL/ELT pipelines)
- Data warehousing (centralized storage)
- Analytics and reporting tools
- Dashboards and data visualization
- Governance and security frameworks
But that definition barely scratches the surface.
The Evolution of BI
In the early 2000s, BI meant static reports generated from on-premise data warehouses. Tools like SAP BusinessObjects and IBM Cognos dominated the space. Reports were batch-processed overnight. If you needed a new metric, you filed a ticket with IT.
Fast forward to 2026, and the landscape looks different:
- Cloud-native data warehouses like Snowflake and BigQuery
- Real-time streaming with Kafka and Apache Flink
- Self-service BI tools like Power BI, Tableau, and Looker
- Embedded analytics inside SaaS applications
- AI-driven insights and predictive modeling
Modern business intelligence solutions are not just reporting systems — they are dynamic analytics ecosystems.
Core Components of a BI Architecture
Here’s a simplified architecture diagram in markdown form:
[Data Sources]
   |-- CRM (Salesforce)
   |-- ERP (SAP)
   |-- Marketing (Google Ads)
   |-- App Database (PostgreSQL)
          |
          v
[ETL / ELT Layer]
   |-- Fivetran
   |-- Airflow
   |-- dbt
          |
          v
[Data Warehouse]
   |-- Snowflake
   |-- BigQuery
   |-- Redshift
          |
          v
[BI & Visualization]
   |-- Power BI
   |-- Tableau
   |-- Looker
Each layer plays a distinct role. When one fails, the entire analytics pipeline suffers.
BI vs. Business Analytics vs. Data Science
These terms often get mixed up. Here’s a practical comparison:
| Aspect | Business Intelligence | Business Analytics | Data Science |
|---|---|---|---|
| Focus | Descriptive & diagnostic | Predictive | Predictive & prescriptive |
| Users | Executives, managers | Analysts | Data scientists |
| Tools | Power BI, Tableau | Python, R, SQL | Python, ML frameworks |
| Output | Dashboards & reports | Forecasts | ML models |
BI answers: "What happened?" and "Why did it happen?" Analytics asks: "What will happen?" Data science explores: "What should we do next?"
Strong business intelligence solutions often serve as the foundation for advanced analytics and AI initiatives.
Why Business Intelligence Solutions Matter in 2026
The market for BI and analytics platforms is expected to exceed $40 billion by 2027, according to Statista. But adoption alone doesn’t guarantee value.
Data-Driven Companies Outperform
A 2023 McKinsey report found that organizations that leverage data effectively are 23 times more likely to acquire customers and 19 times more likely to be profitable.
That’s not incremental improvement — that’s competitive separation.
The Rise of Real-Time Decision Making
Customers expect instant responses. Supply chains operate across continents. Financial markets shift in seconds. Waiting for weekly reports is no longer acceptable.
Modern business intelligence solutions enable:
- Real-time sales monitoring
- Dynamic pricing adjustments
- Live fraud detection
- Instant operational alerts
Streaming data pipelines with Kafka and real-time dashboards powered by tools like Looker or Power BI have become standard for fast-moving industries.
Regulatory Pressure and Data Governance
With regulations like GDPR and evolving AI governance frameworks, companies must ensure transparency in data handling. BI systems now include audit trails, role-based access controls, and lineage tracking.
Without a structured BI framework, compliance becomes a nightmare.
Democratization of Analytics
In 2026, business users expect self-service analytics. They don’t want to wait for IT.
However, without guardrails, self-service turns into chaos. The solution? Governed BI environments where business teams explore trusted datasets.
That balance between accessibility and control defines successful business intelligence solutions today.
Architecture of Modern Business Intelligence Solutions
Let’s break down how high-performing organizations design their BI systems.
1. Data Ingestion Layer
This is where raw data enters the ecosystem.
Common tools:
- Fivetran (managed connectors)
- Apache Airflow (workflow orchestration)
- AWS Glue
- Azure Data Factory
A typical ELT workflow using Airflow might look like:
from airflow import DAG
from airflow.operators.bash import BashOperator
from datetime import datetime

with DAG('etl_pipeline', start_date=datetime(2025,1,1)) as dag:
    extract = BashOperator(
        task_id='extract',
        bash_command='python extract.py'
    )
    load = BashOperator(
        task_id='load',
        bash_command='python load_to_snowflake.py'
    )

    extract >> load
2. Data Storage: Warehouse vs. Lake
| Feature | Data Warehouse | Data Lake |
|---|---|---|
| Structure | Structured | Raw, structured & unstructured |
| Query Speed | High | Moderate |
| Cost | Higher | Lower |
| Use Case | BI dashboards | ML & large-scale analytics |
Many organizations adopt a lakehouse architecture (e.g., Databricks Delta Lake), combining both worlds.
3. Data Modeling with dbt
Raw data is messy. dbt (data build tool) transforms it into analytics-ready models.
Example SQL model:
SELECT
  customer_id,
  SUM(order_total) AS lifetime_value
FROM orders
GROUP BY customer_id;
Clear modeling ensures consistent KPIs across dashboards.
4. Visualization & Reporting
Tools like Power BI and Tableau allow:
- Interactive dashboards
- Drill-down capabilities
- Scheduled reporting
- Embedded analytics
The key isn’t flashy charts — it’s clarity. The best dashboards answer one core business question per page.
Types of Business Intelligence Solutions
Not all BI implementations look the same. Let’s explore common categories.
Enterprise BI Platforms
Used by large organizations with complex data ecosystems.
Examples:
- SAP BusinessObjects
- Oracle Analytics
- Microsoft Power BI (Enterprise tier)
Features include:
- Multi-source integration
- Row-level security
- Scalable cloud infrastructure
Self-Service BI
Designed for non-technical users.
Examples:
- Tableau
- Looker
- Qlik Sense
These tools emphasize drag-and-drop interfaces and intuitive dashboards.
Embedded BI
Analytics integrated into SaaS products.
Example: A fintech app showing user spending trends.
Developers often use:
- Looker Embedded
- Tableau Embedded
- Custom dashboards built with React + D3.js
For companies building analytics-heavy platforms, we often combine BI with custom web application development.
Cloud-Native BI
Built entirely in cloud ecosystems:
- AWS QuickSight
- Azure Synapse Analytics
- Google Looker + BigQuery
Cloud-native BI aligns well with scalable cloud migration strategies.
Implementing Business Intelligence Solutions: Step-by-Step
Rolling out BI requires discipline. Here’s a proven framework.
Step 1: Define Clear Business Objectives
Avoid starting with tools. Start with questions.
Examples:
- What is our customer acquisition cost by channel?
- Which products have the highest margin volatility?
- Where are operational bottlenecks?
Step 2: Audit Data Sources
Catalog:
- Databases
- APIs
- Third-party platforms
- Manual spreadsheets
Identify data gaps early.
Step 3: Design Data Architecture
Choose:
- Warehouse (Snowflake vs. BigQuery)
- ETL tools
- Governance framework
This stage often overlaps with broader DevOps automation practices.
Step 4: Build Data Models
Define consistent metrics:
- Revenue
- Active users
- Churn rate
- Gross margin
Document every definition.
Step 5: Develop Dashboards
Best practice:
- Executive dashboard (5-7 KPIs)
- Departmental dashboards
- Operational dashboards
Step 6: Train Users
Adoption determines ROI. Run workshops. Provide documentation.
Step 7: Iterate
BI is never "done." Business evolves. Metrics change.
Real-World Examples of Business Intelligence Solutions
E-Commerce Retailer
A mid-sized retailer integrated Shopify, Google Analytics, and Stripe into Snowflake.
Results:
- 18% increase in marketing ROI
- 12% reduction in inventory holding costs
- Real-time sales visibility
Healthcare Provider
Used Power BI with Azure Synapse to monitor patient wait times.
Outcome:
- Reduced average wait time by 22%
- Improved staff allocation efficiency
SaaS Startup
Embedded BI dashboards inside their platform using React and D3.
This approach aligned with modern UI/UX design principles.
Customer churn decreased after users gained visibility into performance metrics.
How GitNexa Approaches Business Intelligence Solutions
At GitNexa, we treat business intelligence solutions as strategic infrastructure, not just reporting tools.
Our process typically includes:
- Business discovery workshops
- Data architecture design
- Cloud-native warehouse implementation
- ETL/ELT pipeline setup
- Dashboard design aligned with KPIs
- Governance and security implementation
We often integrate BI with broader initiatives such as AI-powered analytics solutions and scalable enterprise cloud architecture.
Our focus remains practical: clean data models, intuitive dashboards, and measurable ROI.
Common Mistakes to Avoid
- Starting with tools instead of business goals.
- Ignoring data quality issues.
- Creating too many dashboards.
- Lack of executive sponsorship.
- Poor documentation of KPIs.
- Overcomplicating architecture early.
- Neglecting user training.
Each of these can derail even well-funded BI projects.
Best Practices & Pro Tips
- Define a single source of truth.
- Automate data validation checks.
- Use role-based access controls.
- Limit executive dashboards to critical KPIs.
- Document every metric definition.
- Monitor dashboard usage analytics.
- Start small, scale gradually.
- Align BI strategy with overall digital transformation goals.
Future Trends & What to Expect (2026-2027)
- AI-generated insights embedded in dashboards
- Natural language querying ("Show Q2 revenue by region")
- Data mesh architectures
- Greater focus on data privacy and governance
- Increased adoption of real-time analytics
According to Gartner’s analytics predictions (https://www.gartner.com), augmented analytics will dominate enterprise BI investments through 2027.
FAQ
What are business intelligence solutions used for?
They help organizations analyze data, generate insights, and make informed decisions through dashboards, reports, and analytics tools.
What is the difference between BI and data analytics?
BI focuses on descriptive reporting, while analytics often includes predictive modeling and forecasting.
How much do BI solutions cost?
Costs vary widely — from a few thousand dollars annually for small businesses to millions for enterprise-scale deployments.
Which BI tool is best in 2026?
Power BI, Tableau, and Looker remain market leaders, depending on ecosystem alignment.
Can startups benefit from BI?
Yes. Even early-stage startups use BI to track CAC, LTV, churn, and growth metrics.
Is cloud BI better than on-premise?
Cloud BI offers scalability, lower upfront costs, and faster deployment.
How long does implementation take?
Small projects may take 6-8 weeks. Enterprise systems can take 6-12 months.
Do BI solutions support AI integration?
Yes. Many platforms integrate with ML models and AI analytics frameworks.
Conclusion
Business intelligence solutions transform scattered data into strategic insight. They align teams, sharpen decision-making, and create measurable competitive advantage. But success requires more than dashboards — it demands thoughtful architecture, governance, and user adoption.
If your organization is ready to move from reactive reporting to proactive intelligence, now is the time to act.
Ready to implement powerful business intelligence solutions? Talk to our team to discuss your project.
Comments
Loading comments...